
 EN
EN
 ar
ar bg
bg hr
hr cs
cs da
da nl
nl fi
fi fr
fr de
de el
el hi
hi it
it ko
ko no
no pl
pl pt
pt ro
ro ru
ru es
es sv
sv tl
tl iw
iw id
id lv
lv lt
lt sr
sr sk
sk sl
sl uk
uk vi
vi et
et hu
hu th
th tr
tr fa
fa ms
ms hy
hy ka
ka ur
ur bn
bn mn
mn ta
ta kk
kk uz
uz ku
ku
Real-Time Dam Safety Alerts with Differential Pressure Water Level Sensors
Key Takeaways An alert chain needs more than a sensor: define field in...

Load Cell Connection Diagram: Step-by-Step Wiring
Getting the wiring right on a load cell seems simple—until you stare at a handful of loose wires and a pinout that doesn’t match your instrument. A clear load cell connection diagram can save you hours of troubleshooting. Whether you’re connecting a sensor for the first time or re-wiring an older installation, small mistakes like swapped signal leads or missing shield grounds can cause drifting readings or outright failures. At Kingmach Measurement & Monitoring Technology, we field plenty of calls from engineers who skip the diagram and later wonder why their data looks noisy. This guide walks through the most common wiring arrangements, what each wire does, and practical tips to keep your signal clean. We’ll stick to real-world examples, no generic textbook theory.
Technical Detail
Load cell wiring diagrams unpack the handful of connections that turn a physical force into a readable electrical signal. In geotechnical monitoring, where sensors sit in boreholes, under concrete, or at the bottom of a slope, a faulty connection can mean re-excavation or lost data. A typical analog load cell carries five or six conductors: excitation+, excitation–, signal+, signal–, and a shield drain wire. Some 6‑wire cells add sense+ and sense– leads. Those sense lines let the instrument compensate for voltage drops along long cable runs—a detail that’s easy to overlook until you compare readings at the sensor end versus the data logger end. Kingmach supplies its own monitoring instruments with pre-configured connectors for common dataloggers, but still recommends double‑checking the wiring sequence on a published load cell connection diagram. Even color codes vary by manufacturer: a red wire might be excitation+ on one brand but signal+ on another. The industry leans toward a de facto standard (red Ex+, black Ex–, green Sig+, white Sig–), but we’ve seen enough exceptions that a “known” diagram from the supplier is worth hunting down. Beyond the colors, the physical dressing of the wires matters. The bare shield drain should land only at the signal ground of the data acquisition system, not at the load cell body, to avoid ground loops. Our support team often walks users through this when a static reading won’t settle. For installations in wet environments, sealing the cable entry with a suitable grommet or potting compound is just as important as the soldering—moisture migration inside the strain gage cavity can mimic a load change, creating a false alarm. A good load cell connection diagram also flags where to install surge protection if lightning is a risk. Ultimately, a few minutes studying the right diagram and a quick continuity check before finalizing the hookup saves downstream headaches that no recalibration can fix.
News
Key Takeaways An alert chain needs more than a sensor: define field in...
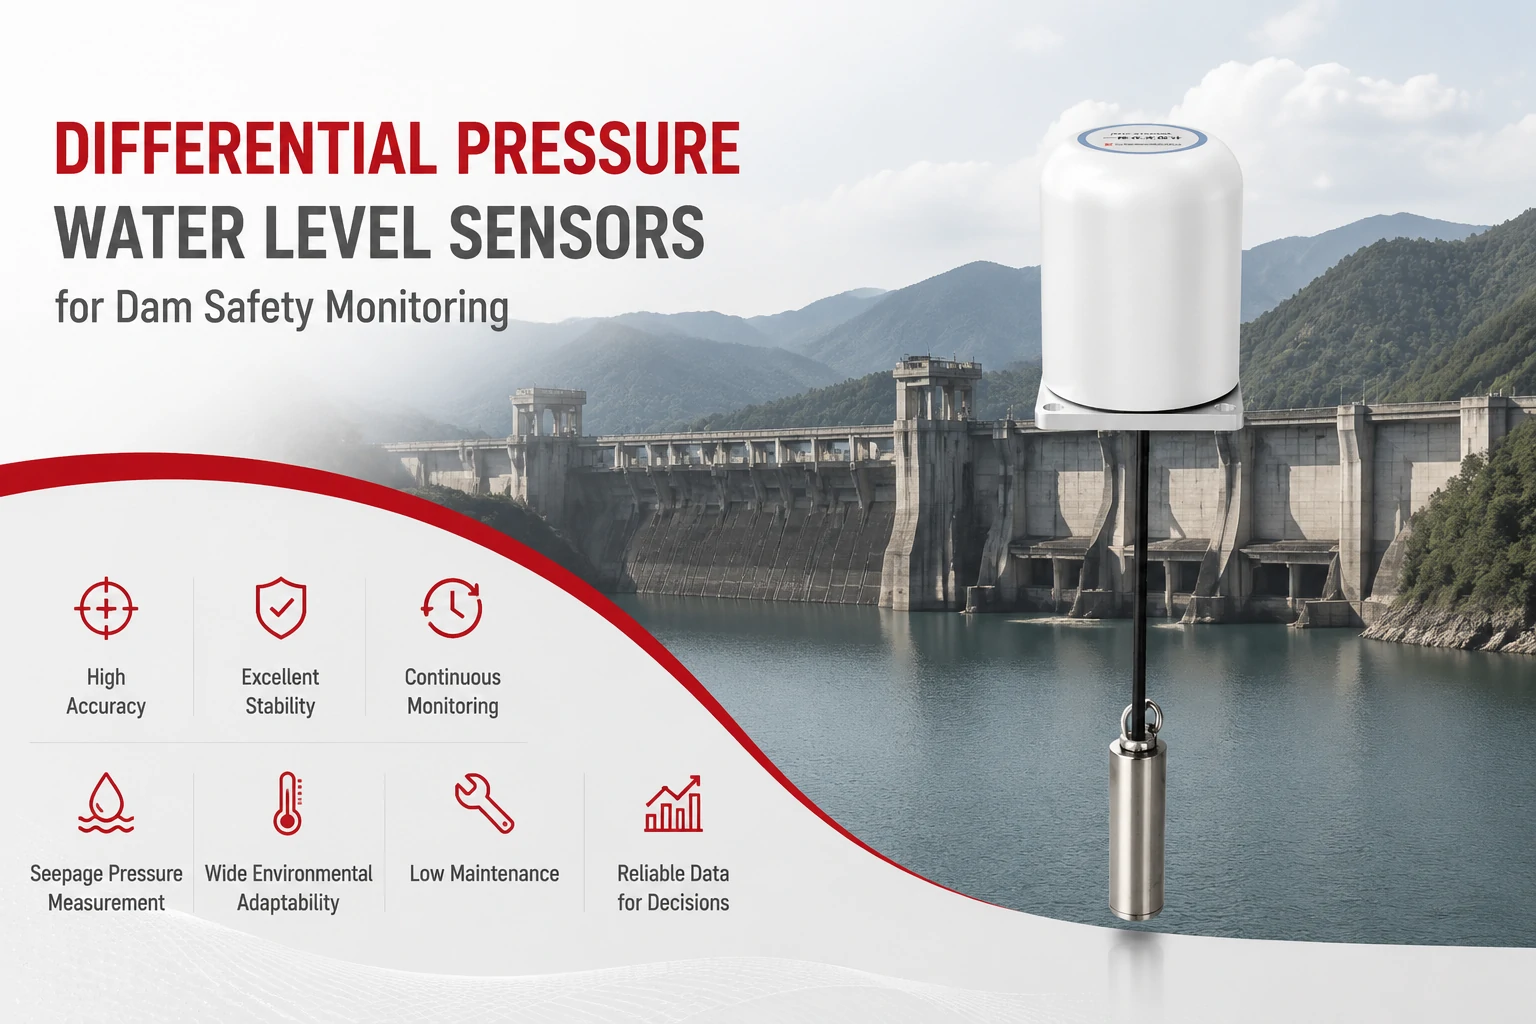
Key Takeaways The strongest fit is usually a confined, submerged, or s...
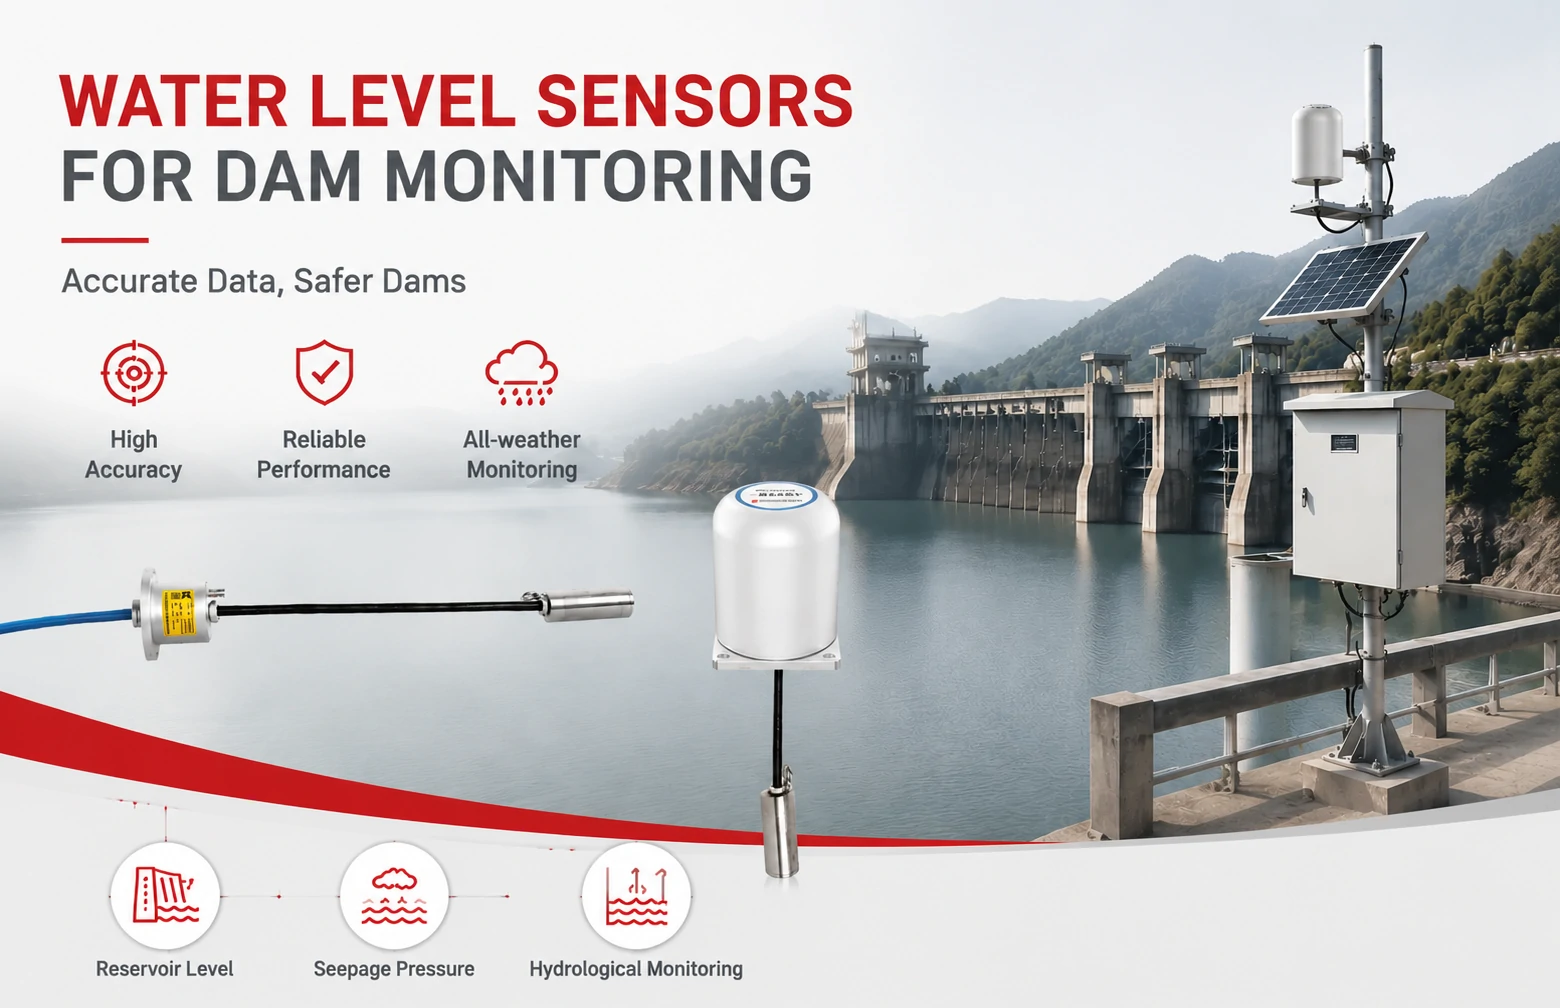
Kingmach Water Level Sensors for Dam Monitoring: A Buyer's Guide to Differential Pre...
Products
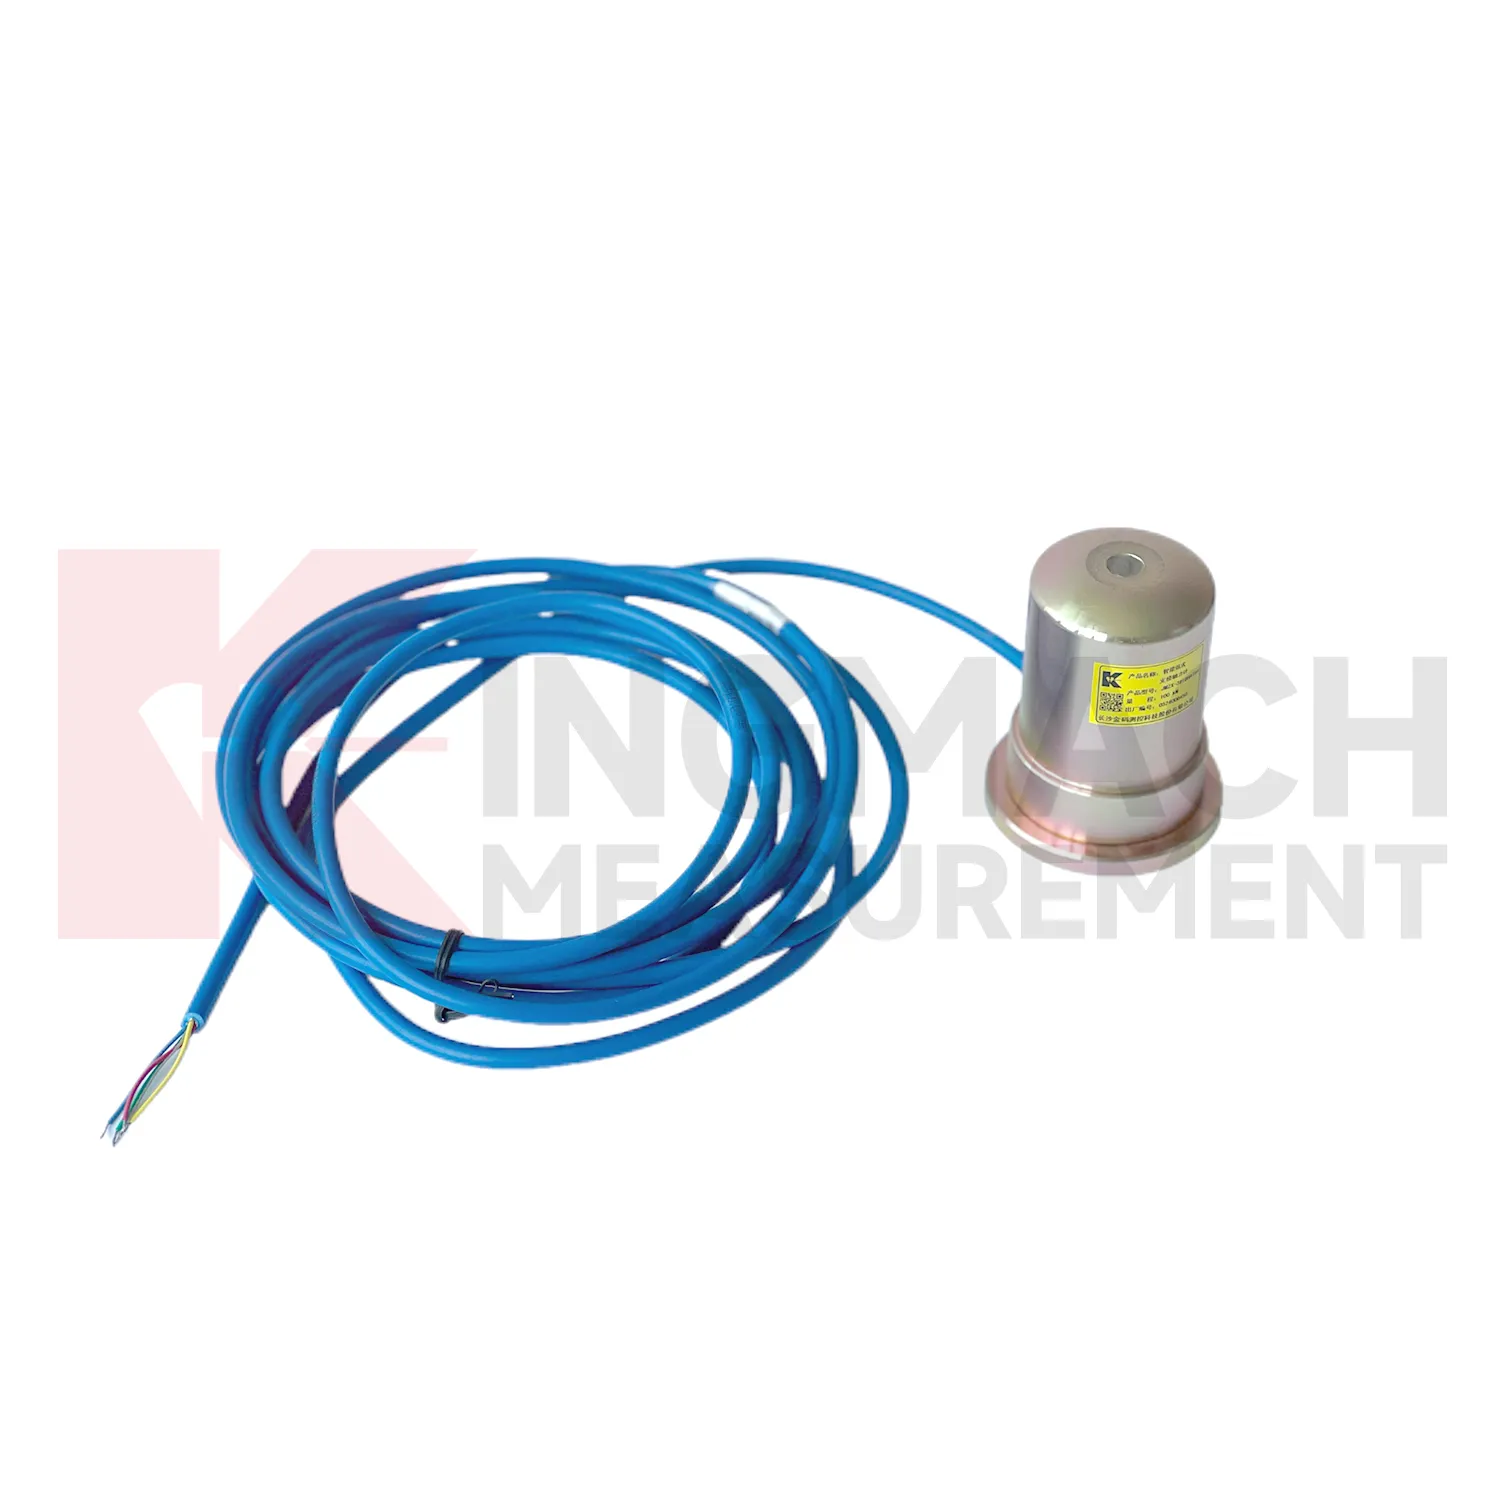
Smart Formwork Axial Force Meter(VW)JMZX-39XXHAT
View Details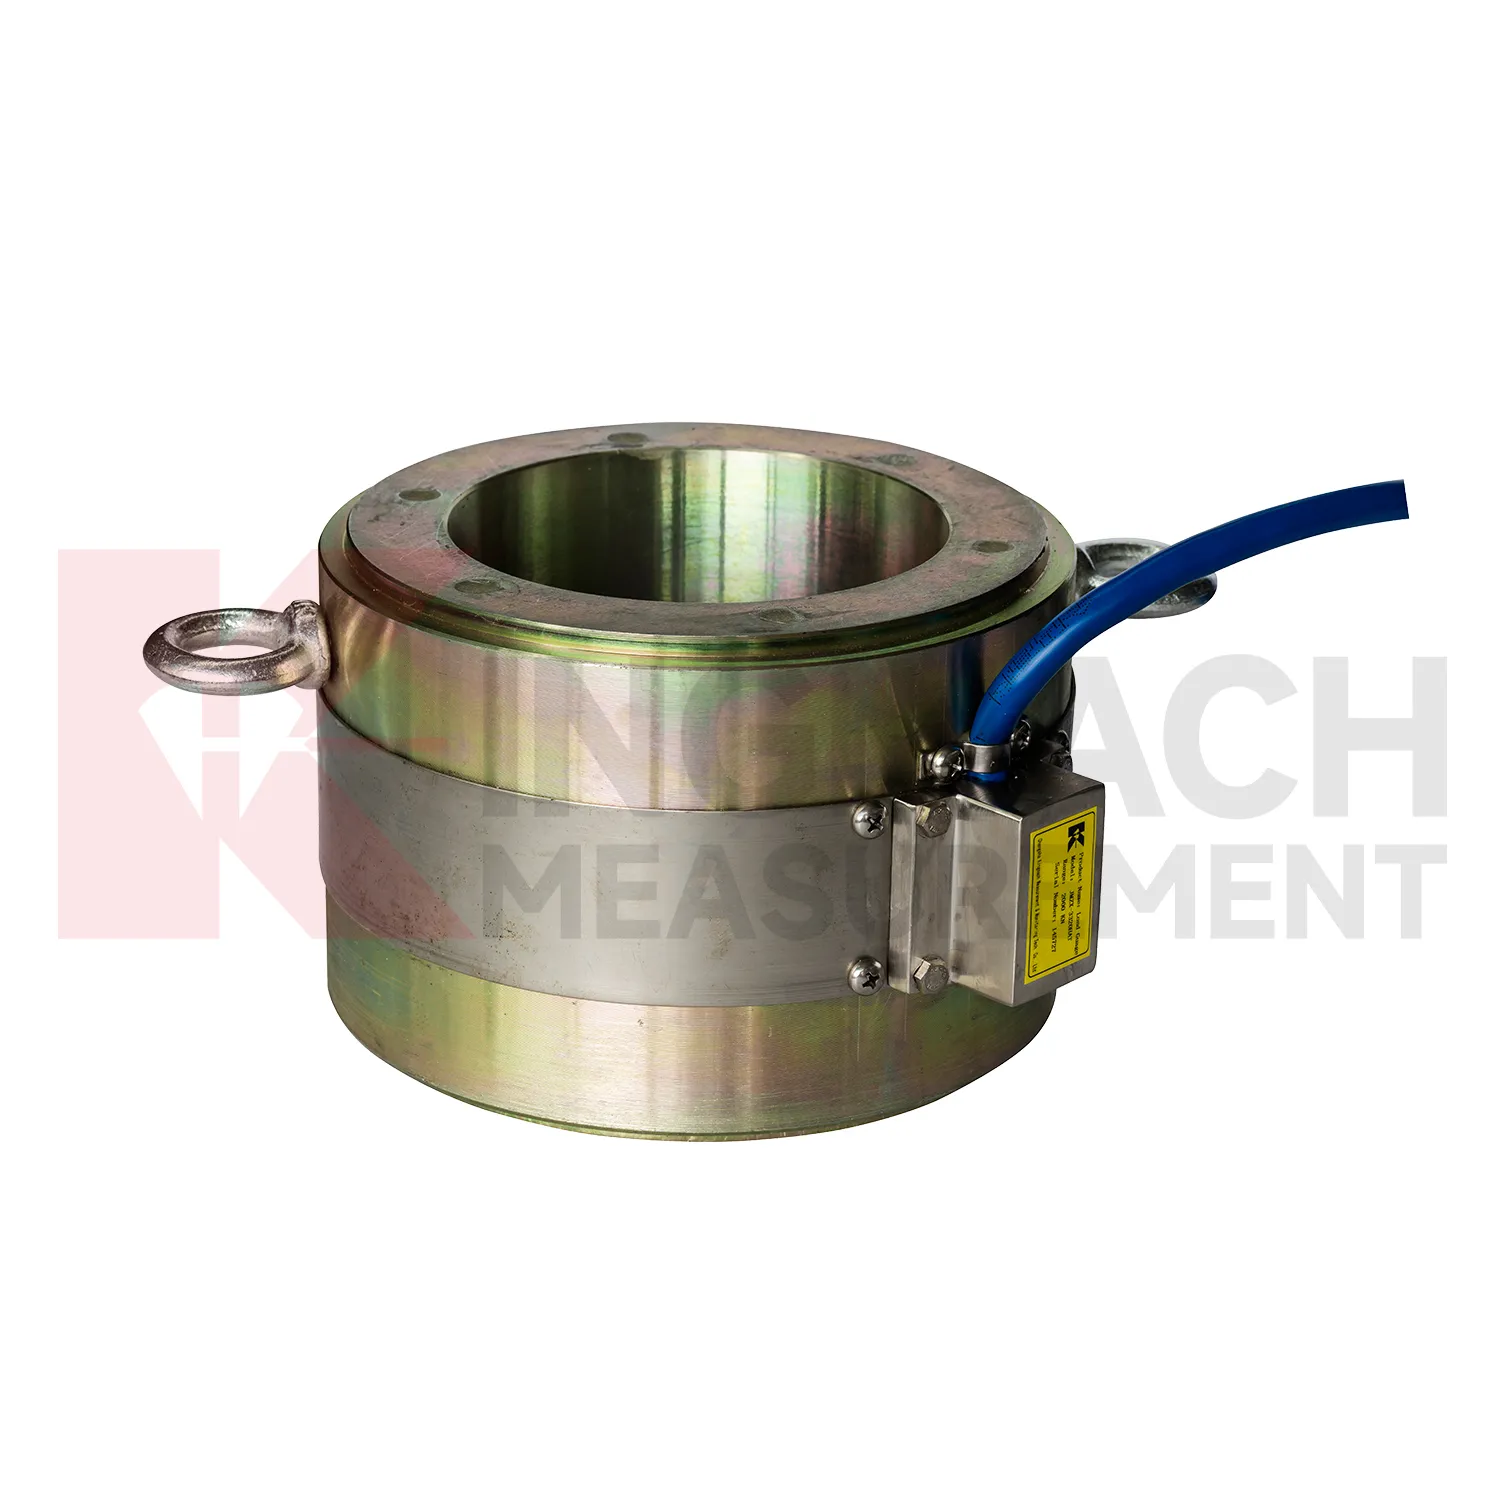
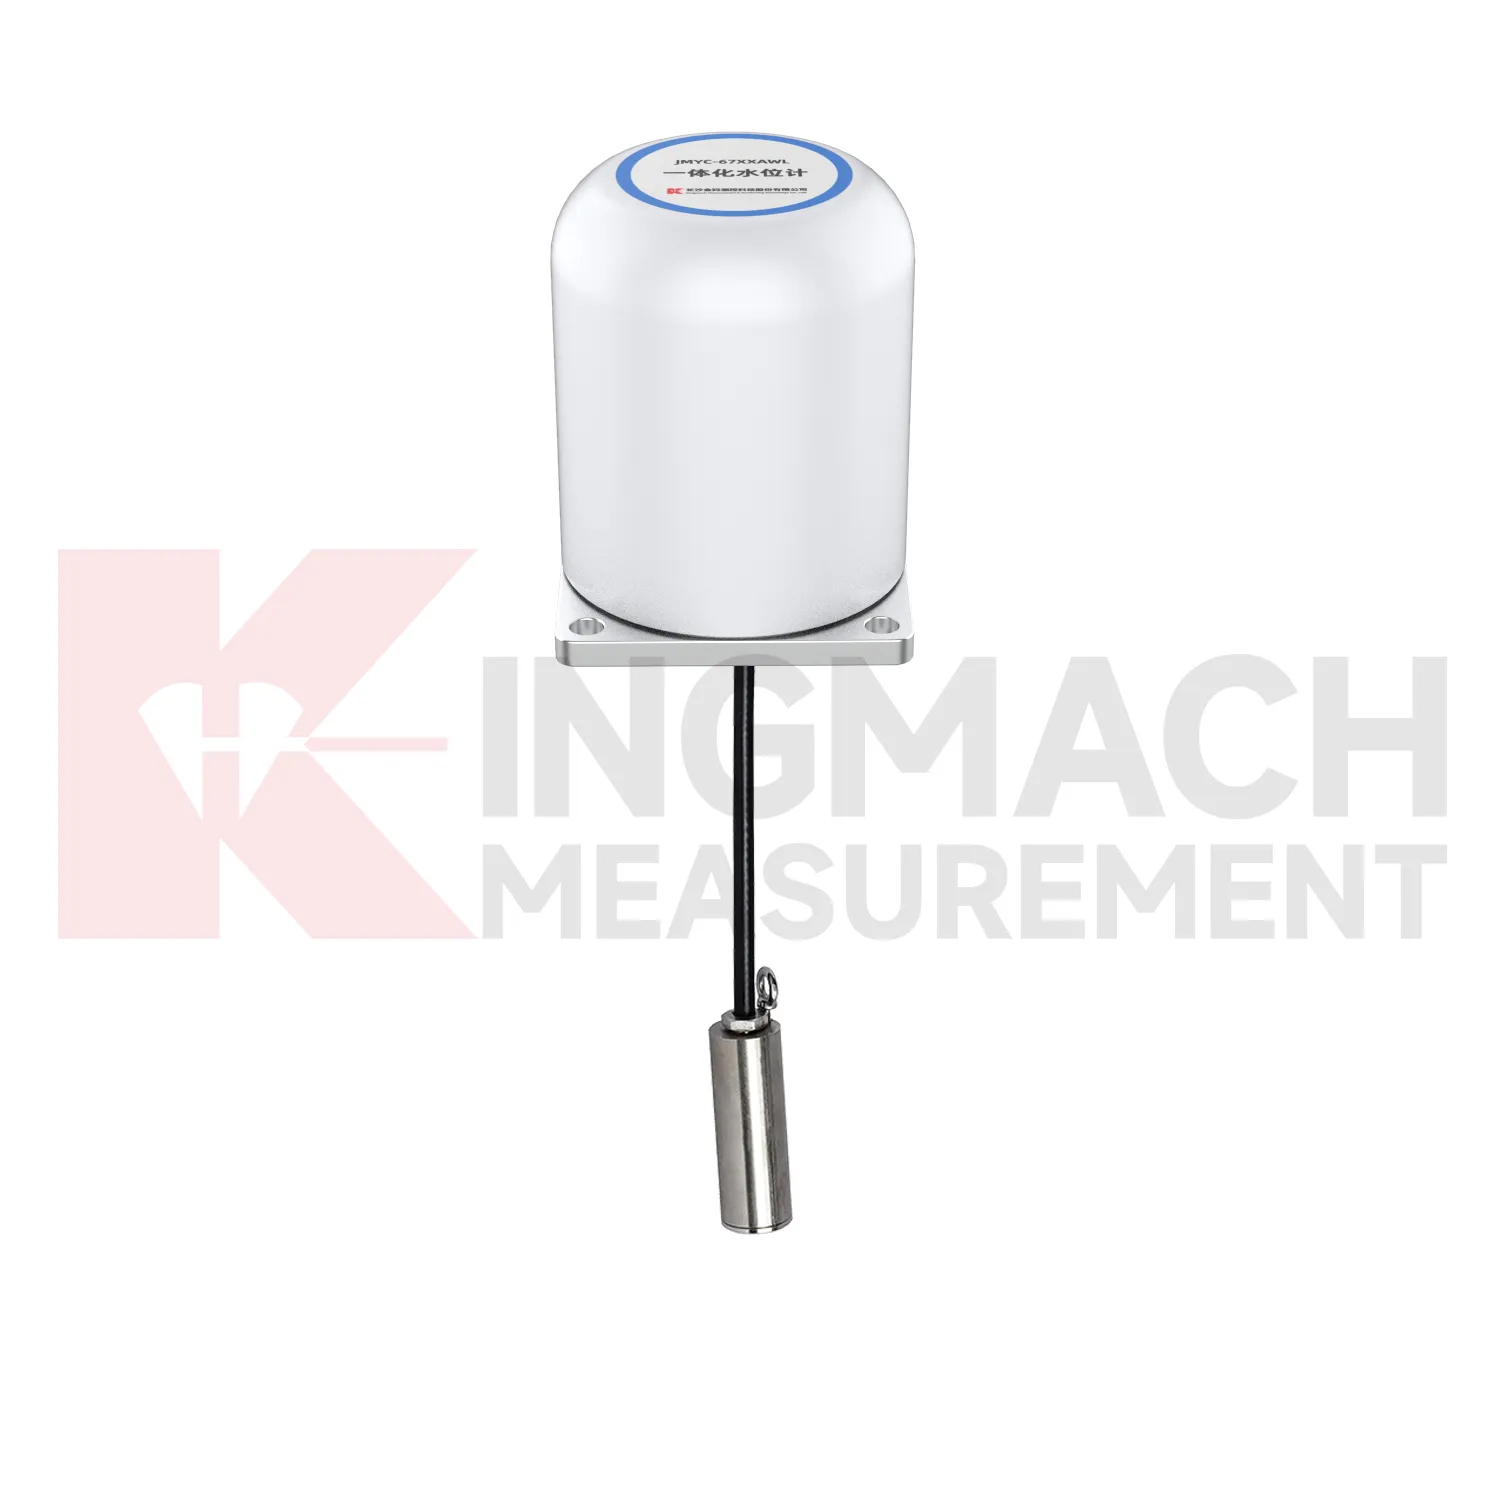
Integrated Wide-Range Differential Pressure Water Level Meter JMYC-67XXAWL
View DetailsFAQ
A 4‑wire diagram leaves out the sense lines. That means the reading at the logger includes the voltage drop in the excitation cables, which gets worse over long distances or in changing temperatures. A 6‑wire diagram connects sense+ and sense– directly to the excitation terminals at the cell, so the instrument can measure the voltage at the cell and adjust its output accordingly. If your cable run is over 10 meters, 6‑wire is usually worth the extra two conductors.
Use a multimeter to identify the pairs. Measure resistance between wires; the excitation pair typically shows the highest resistance (often in the 350 Ω to 1000 Ω range), while the signal pair shows a lower but similar resistance. Once you’ve found the excitation pair, apply a small voltage (if safe to do so) and measure the mV output from the other pair while lightly pressing the cell. This will confirm which is signal+ and signal–. Document what you find for next time.
Drift often points to moisture in the cable or connector, a ground loop, or a bind in the mechanical mounting. Check that the shield drain is grounded only at the logger end and that the cable grip is properly sealed. Also, inspect for any stress on the cable that could be pulling on the solder joints inside the load cell—this can introduce tiny resistance changes that look like a load shift.
Generally no. Even if the connector looks the same, pin assignments and color codes can vary. Always get the diagram specific to your sensor. Kingmach provides wiring documentation with each instrument; if you’re mixing sensors from different suppliers, keep the diagrams on file and label your junction boxes clearly to avoid cross-wiring.
Swapping the signal wires is the most common—you’ll get a reading that changes in the wrong direction (decreasing when load increases). Getting excitation polarity wrong may not damage the cell if it’s a passive strain gage bridge, but some amplified cells won’t work at all. Double-check the diagram before powering up.
Share your product type, target capacity, and application requirements. Our team can review the details and recommend a practical next step.
If you are interested in our products or want to become our partner.
Please leave your contact information, our team will contact you as soon as possible.
Mail: [email protected]
Contact Us: +8613808434127
Address: No. 188 Tongzipo West Rd, Changsha, Hunan, China