
 EN
EN
 ar
ar bg
bg hr
hr cs
cs da
da nl
nl fi
fi fr
fr de
de el
el hi
hi it
it ko
ko no
no pl
pl pt
pt ro
ro ru
ru es
es sv
sv tl
tl iw
iw id
id lv
lv lt
lt sr
sr sk
sk sl
sl uk
uk vi
vi et
et hu
hu th
th tr
tr fa
fa ms
ms hy
hy ka
ka ur
ur bn
bn mn
mn ta
ta kk
kk uz
uz ku
ku
load cell wiring diagram
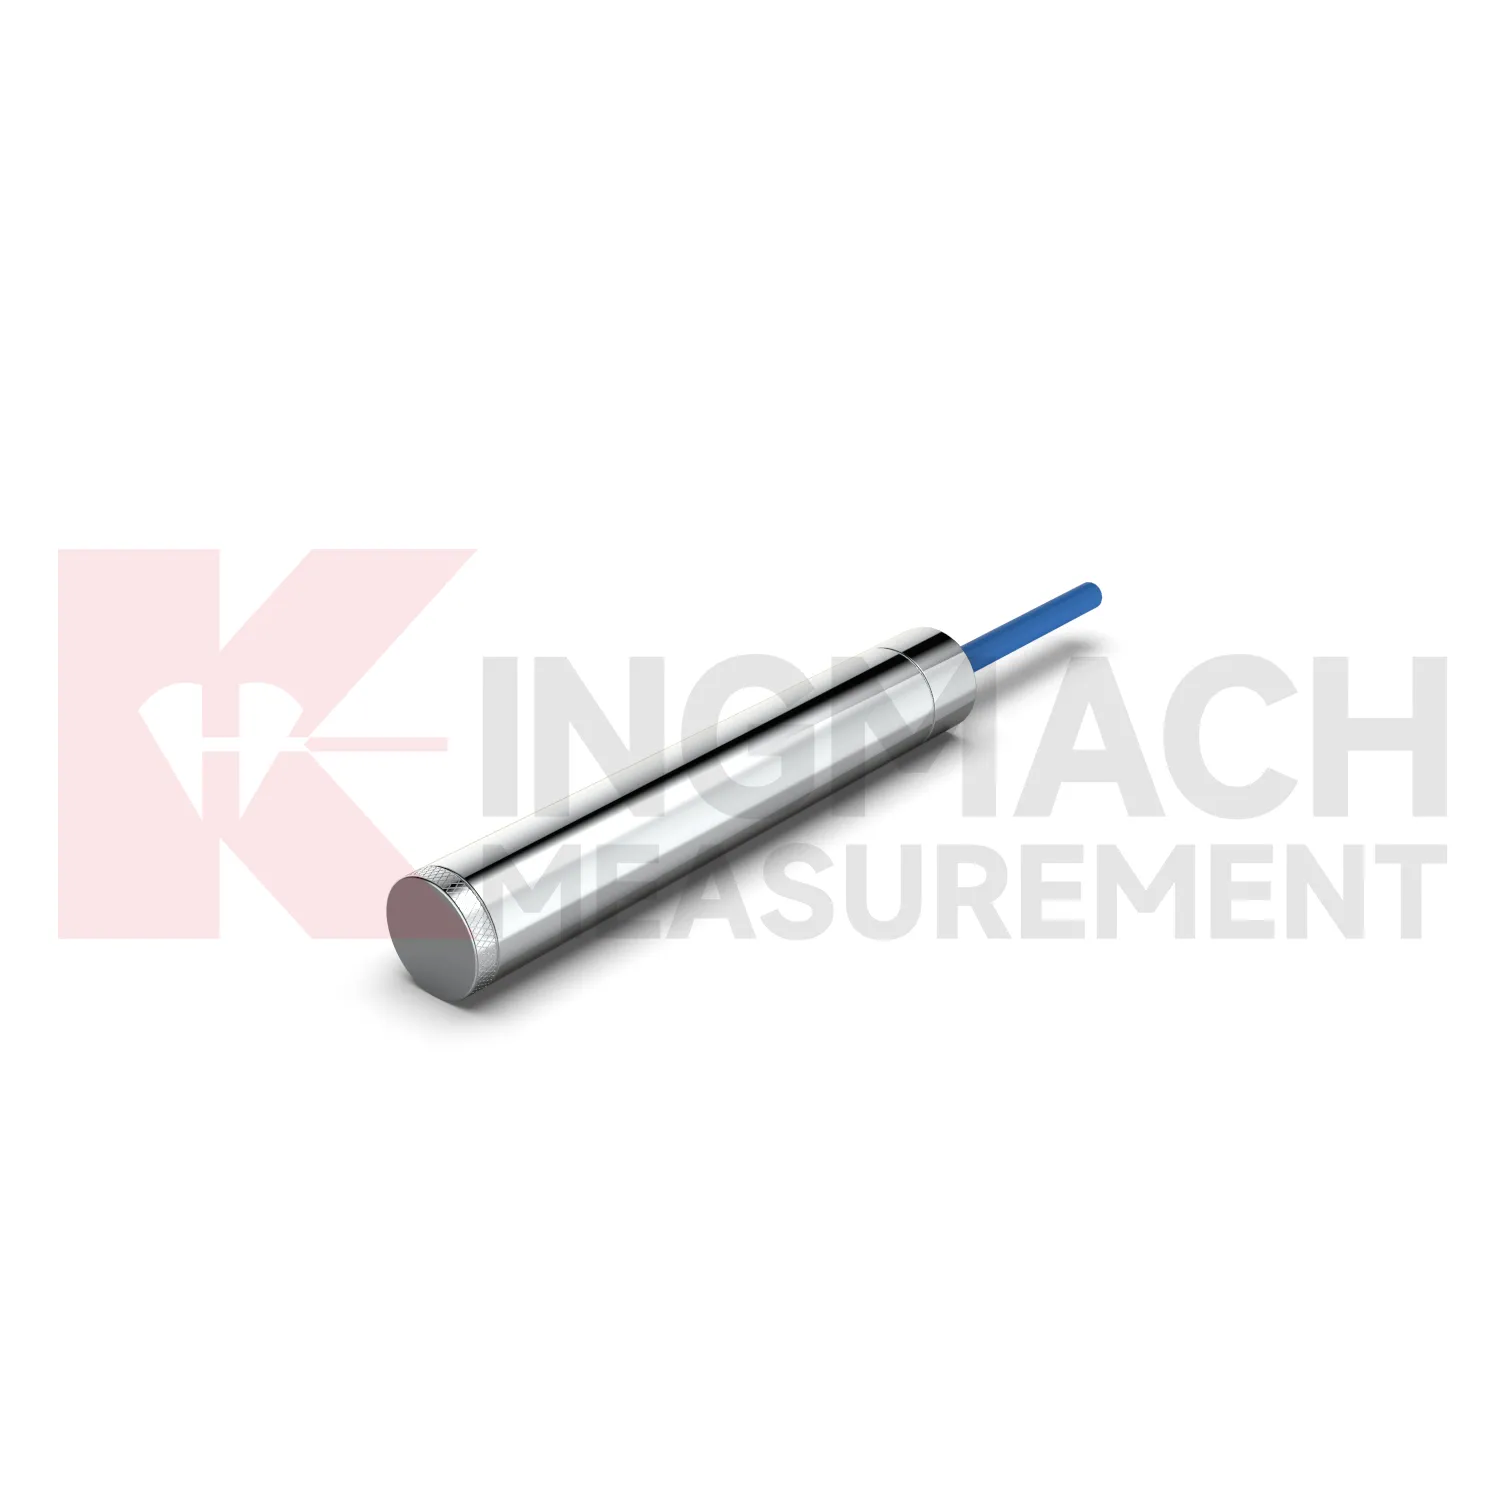
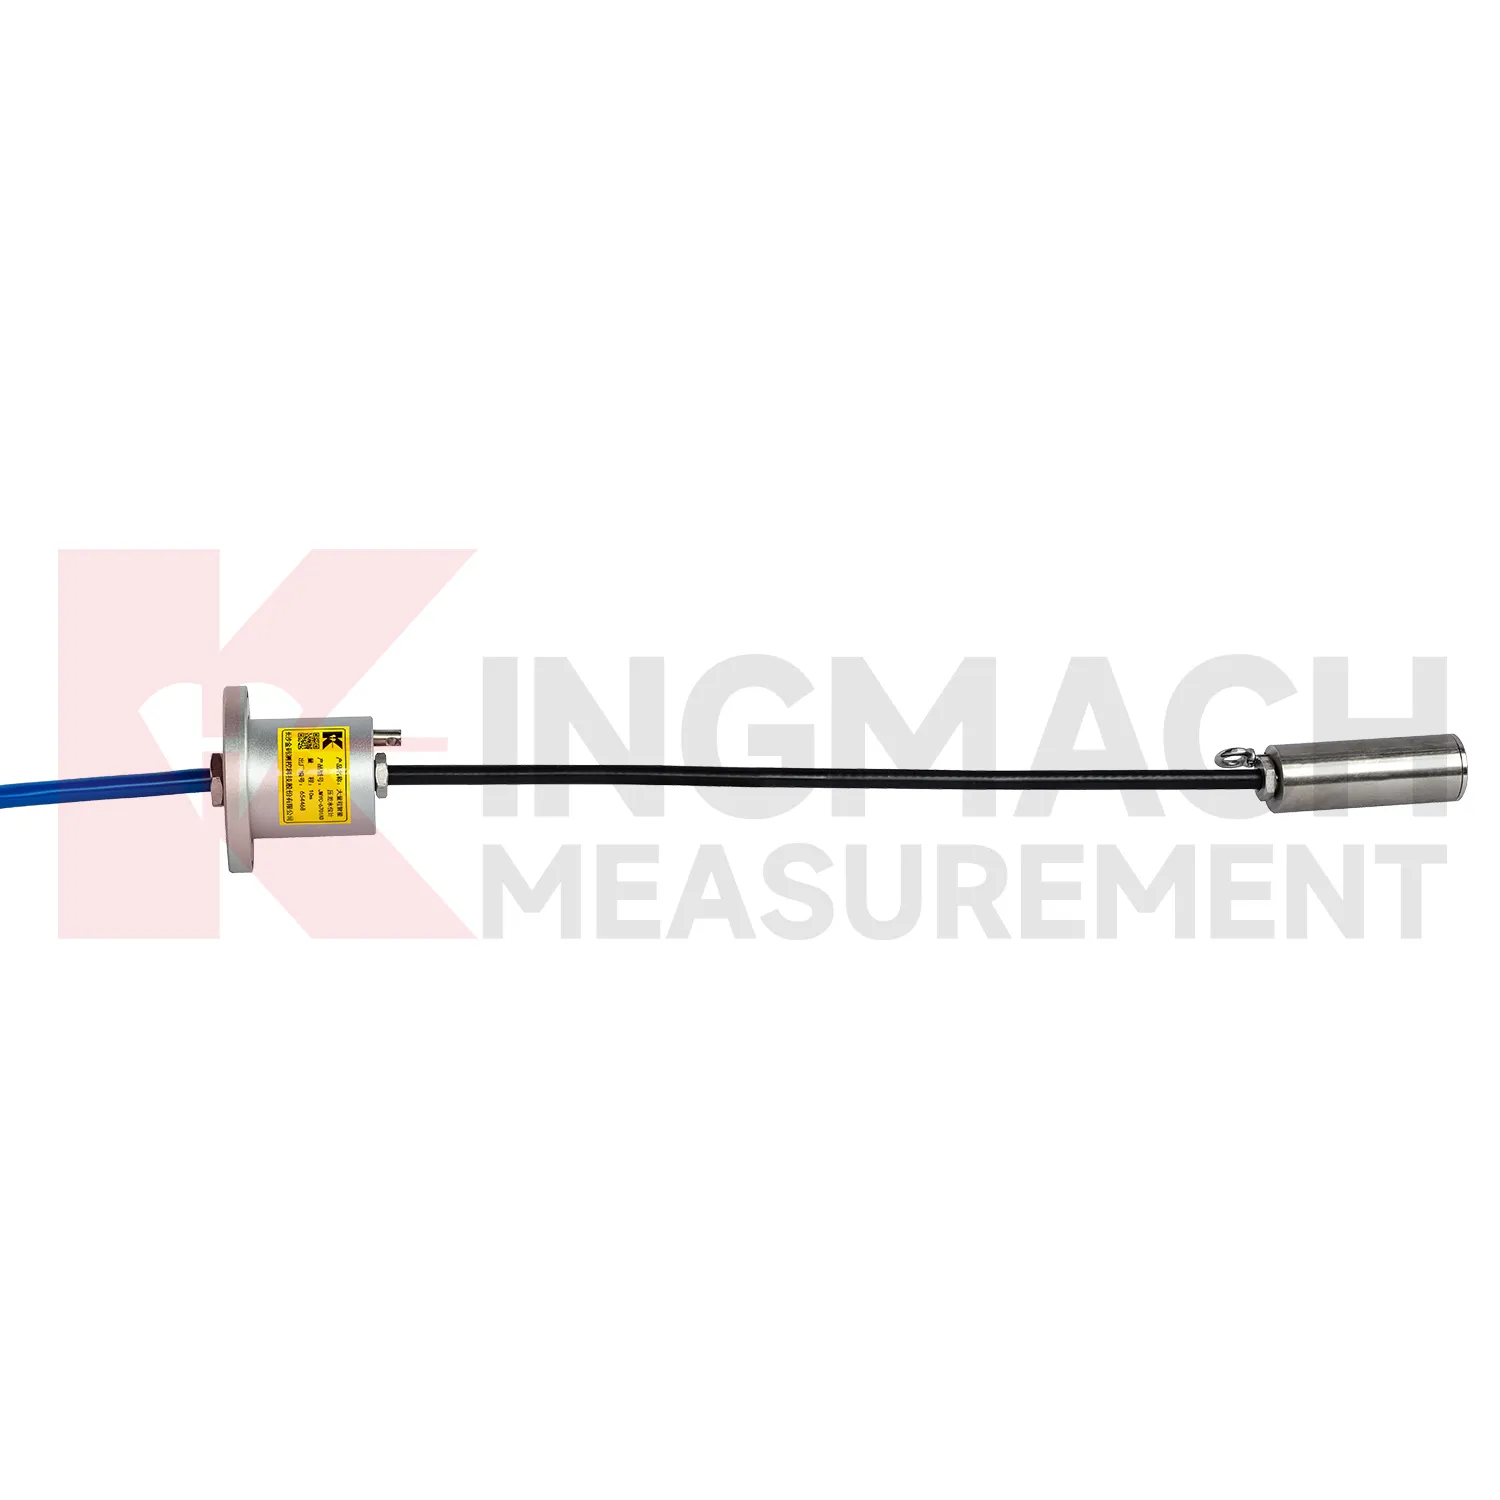
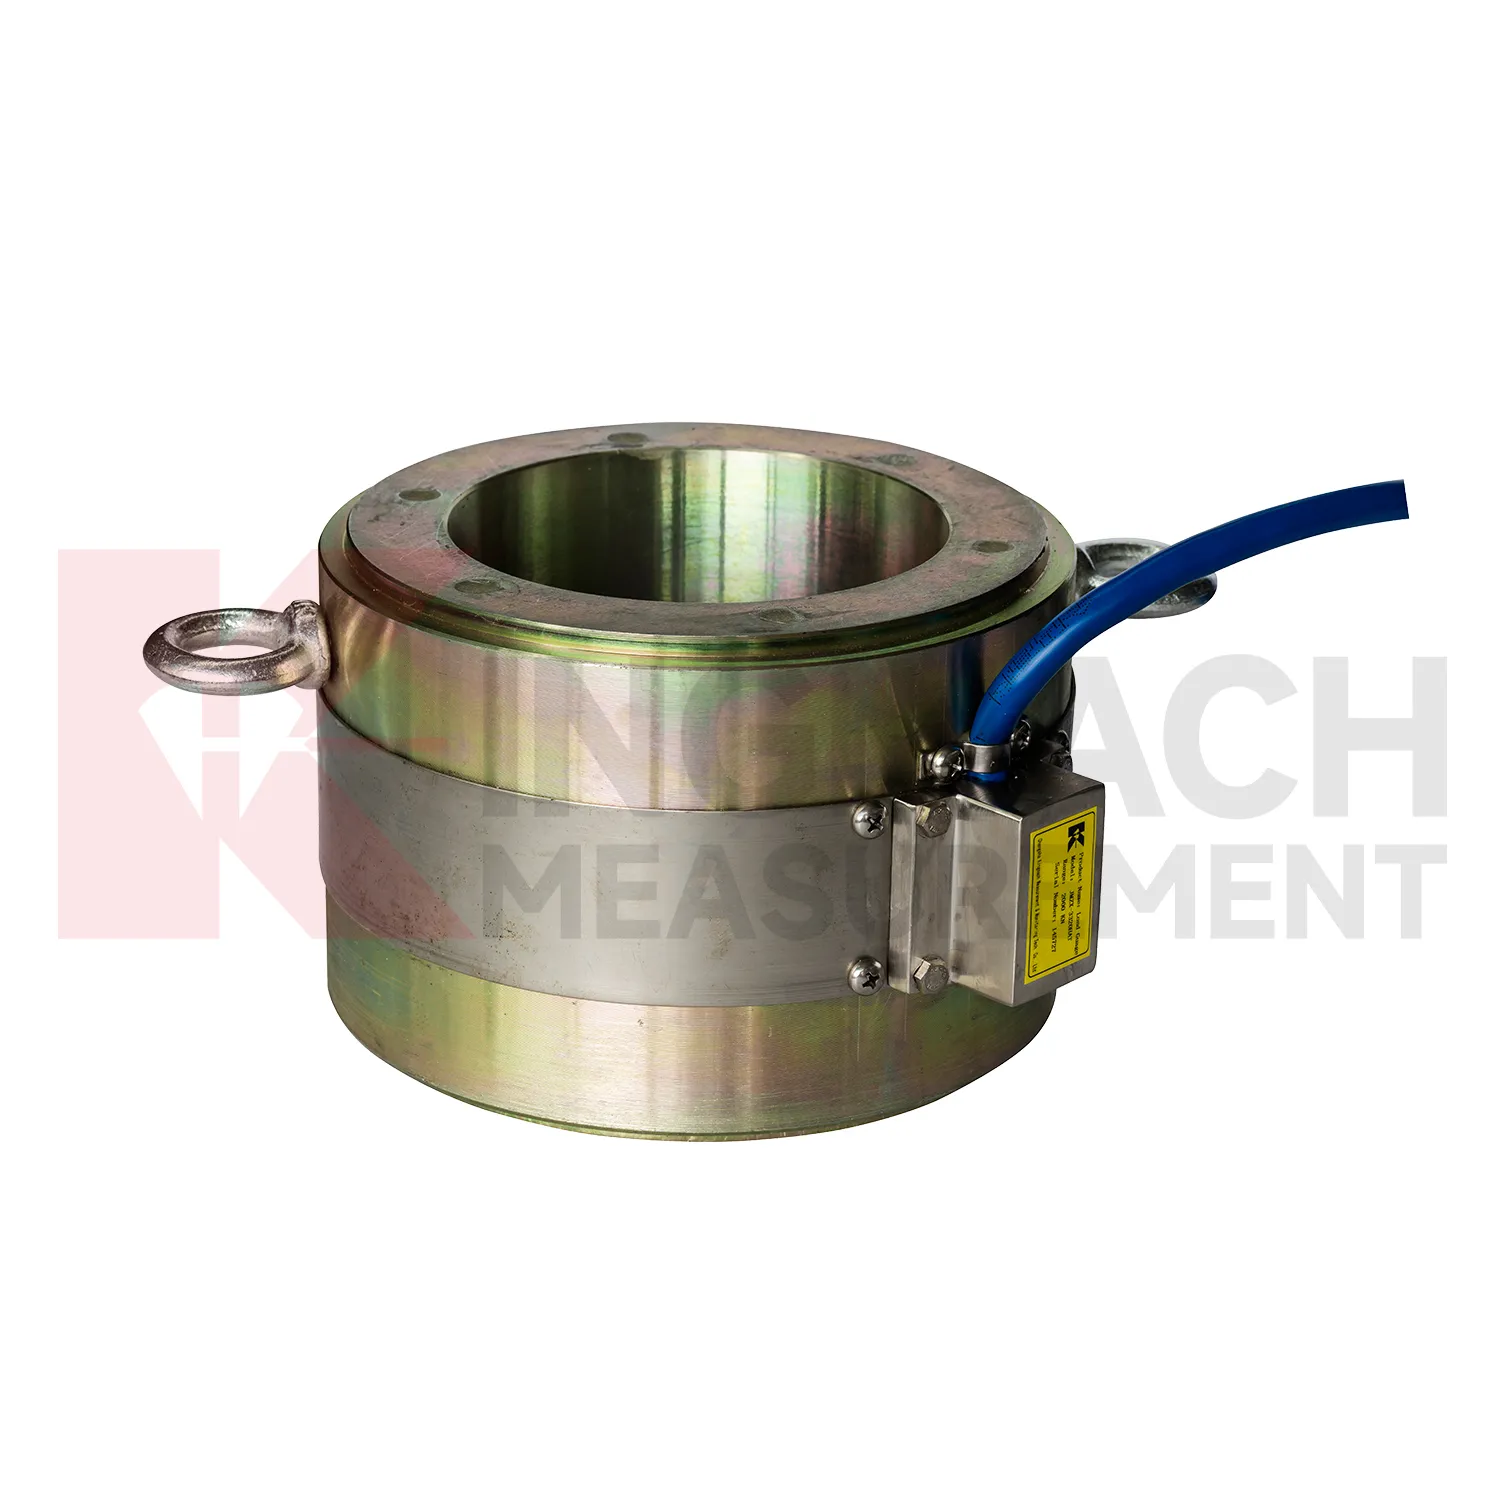
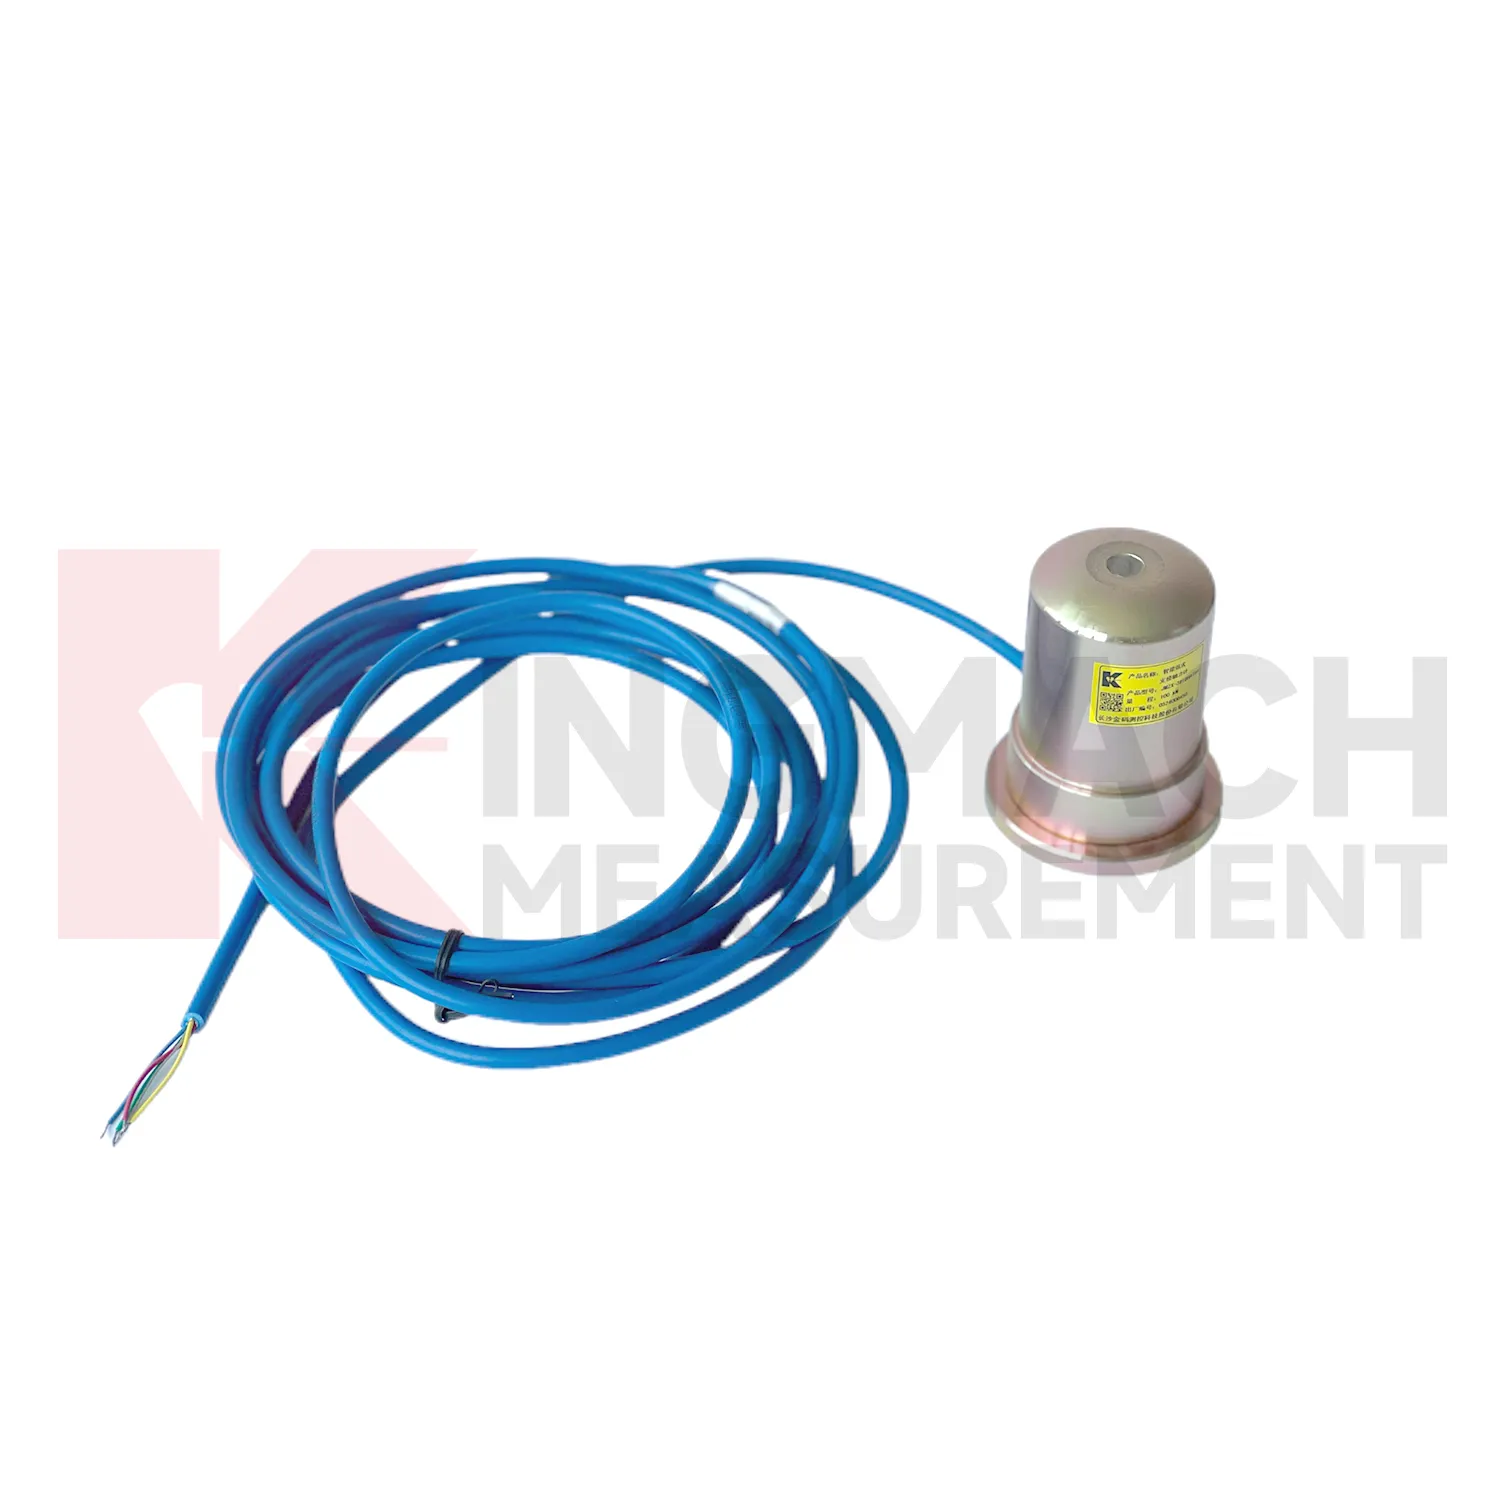
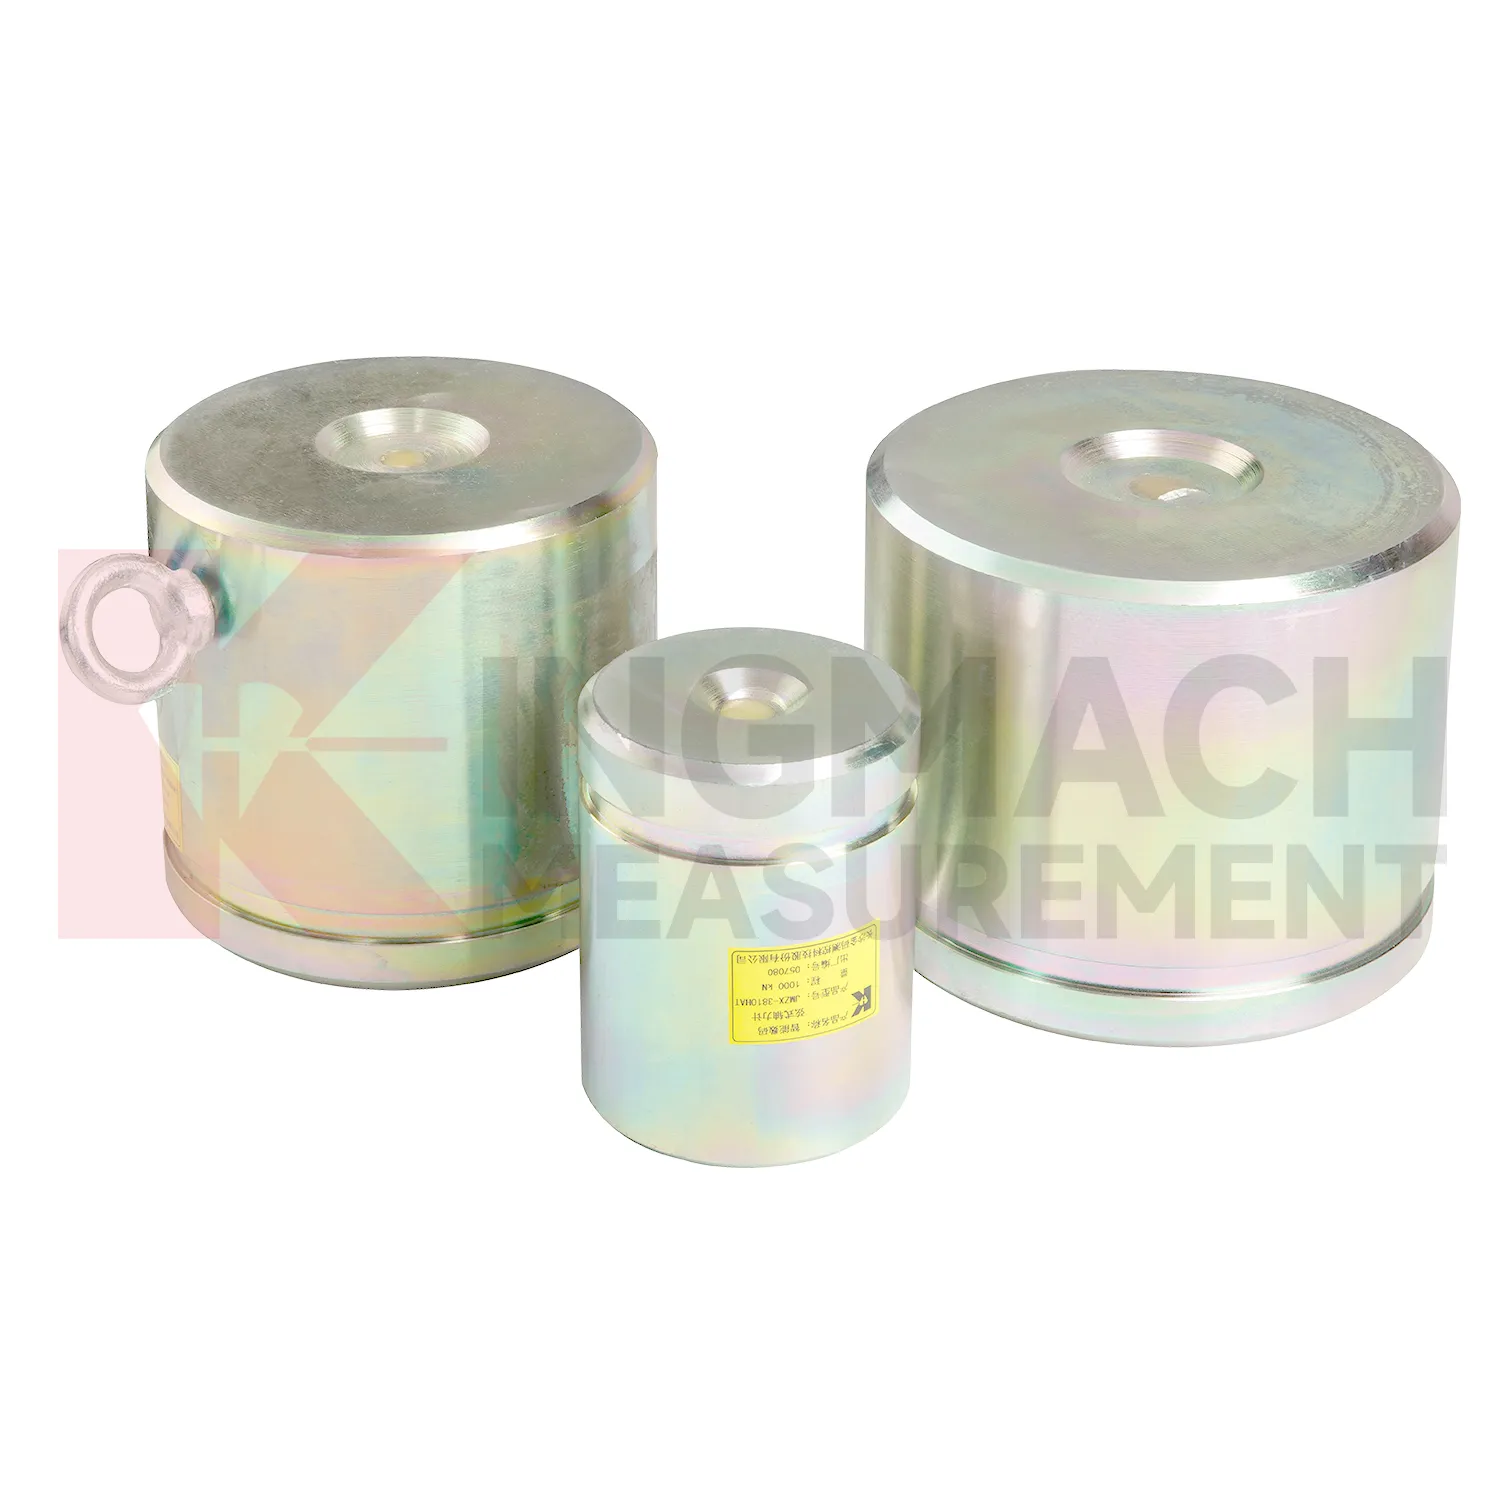
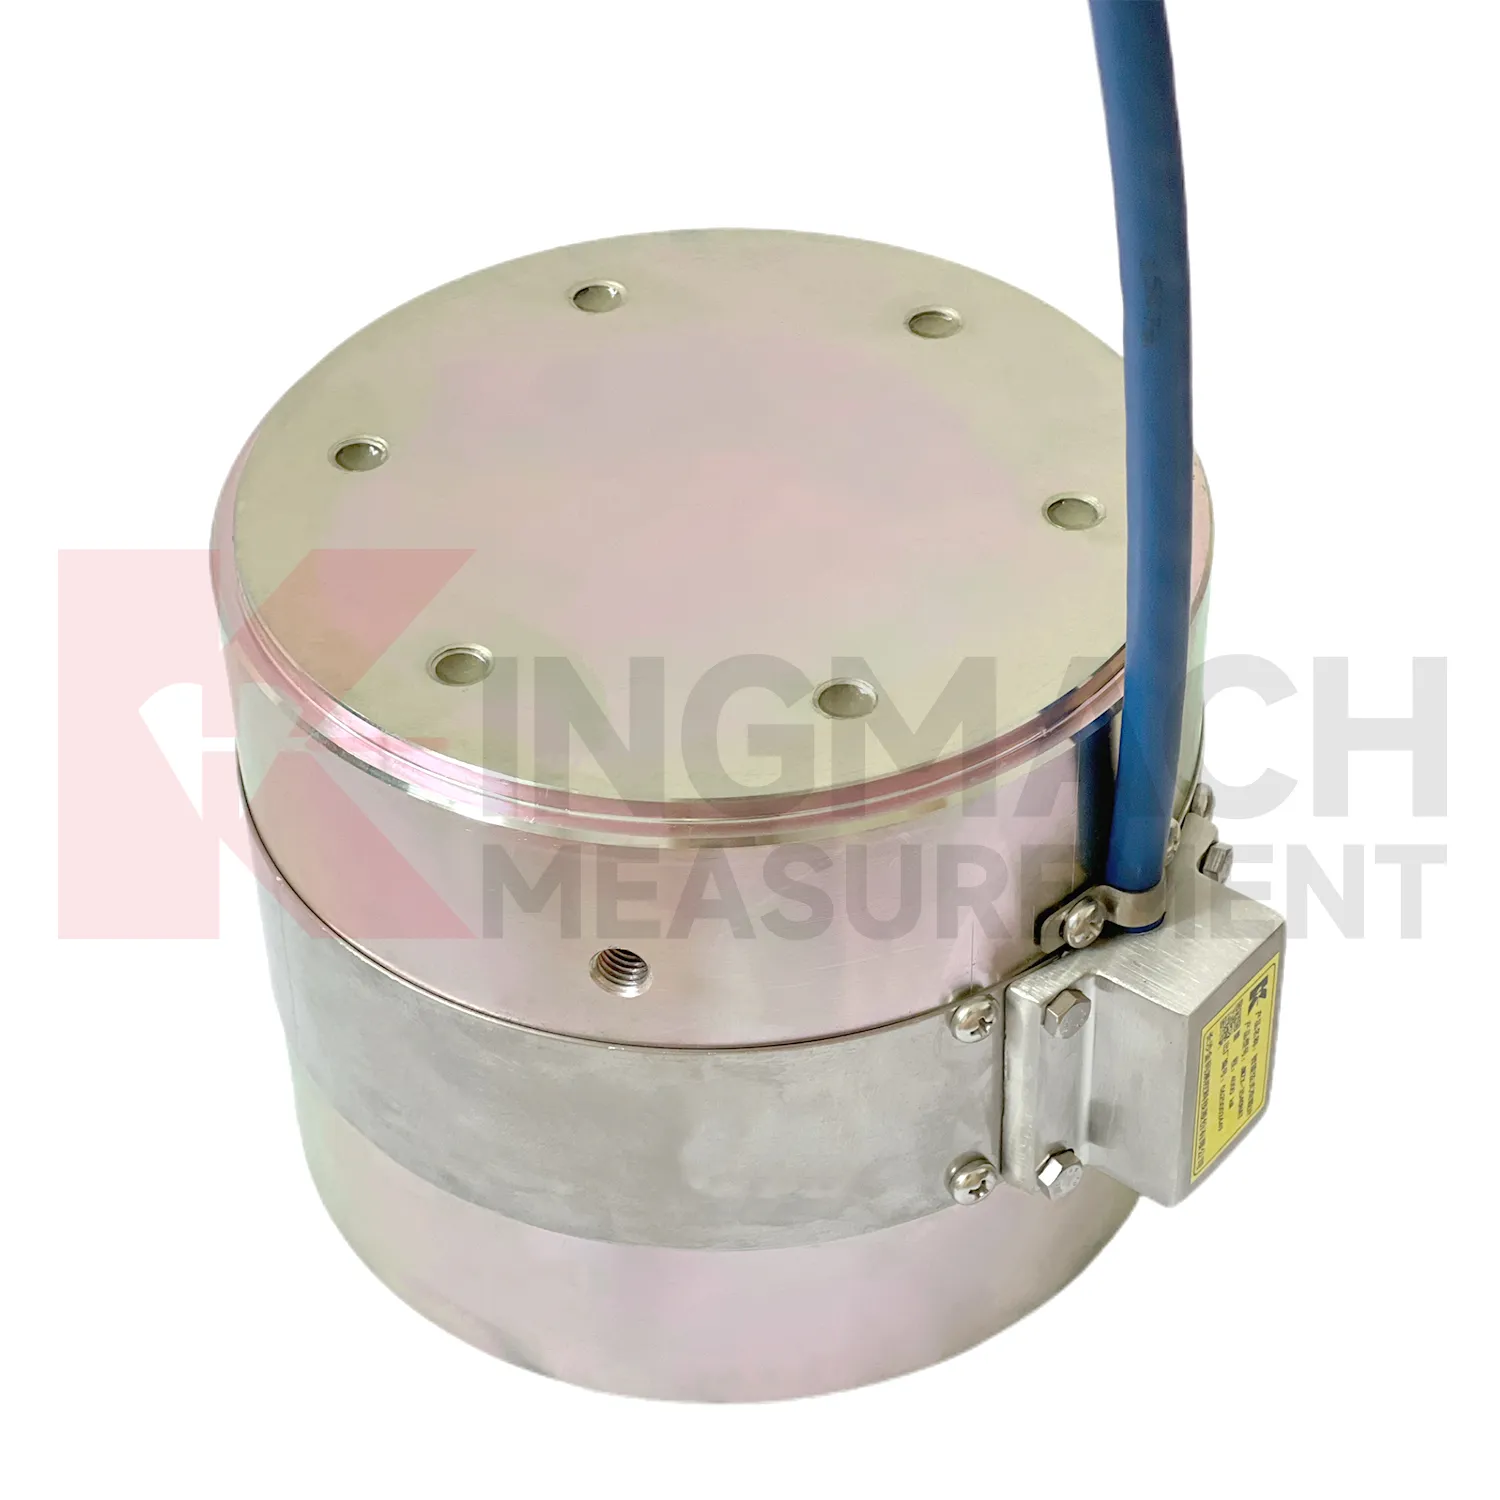
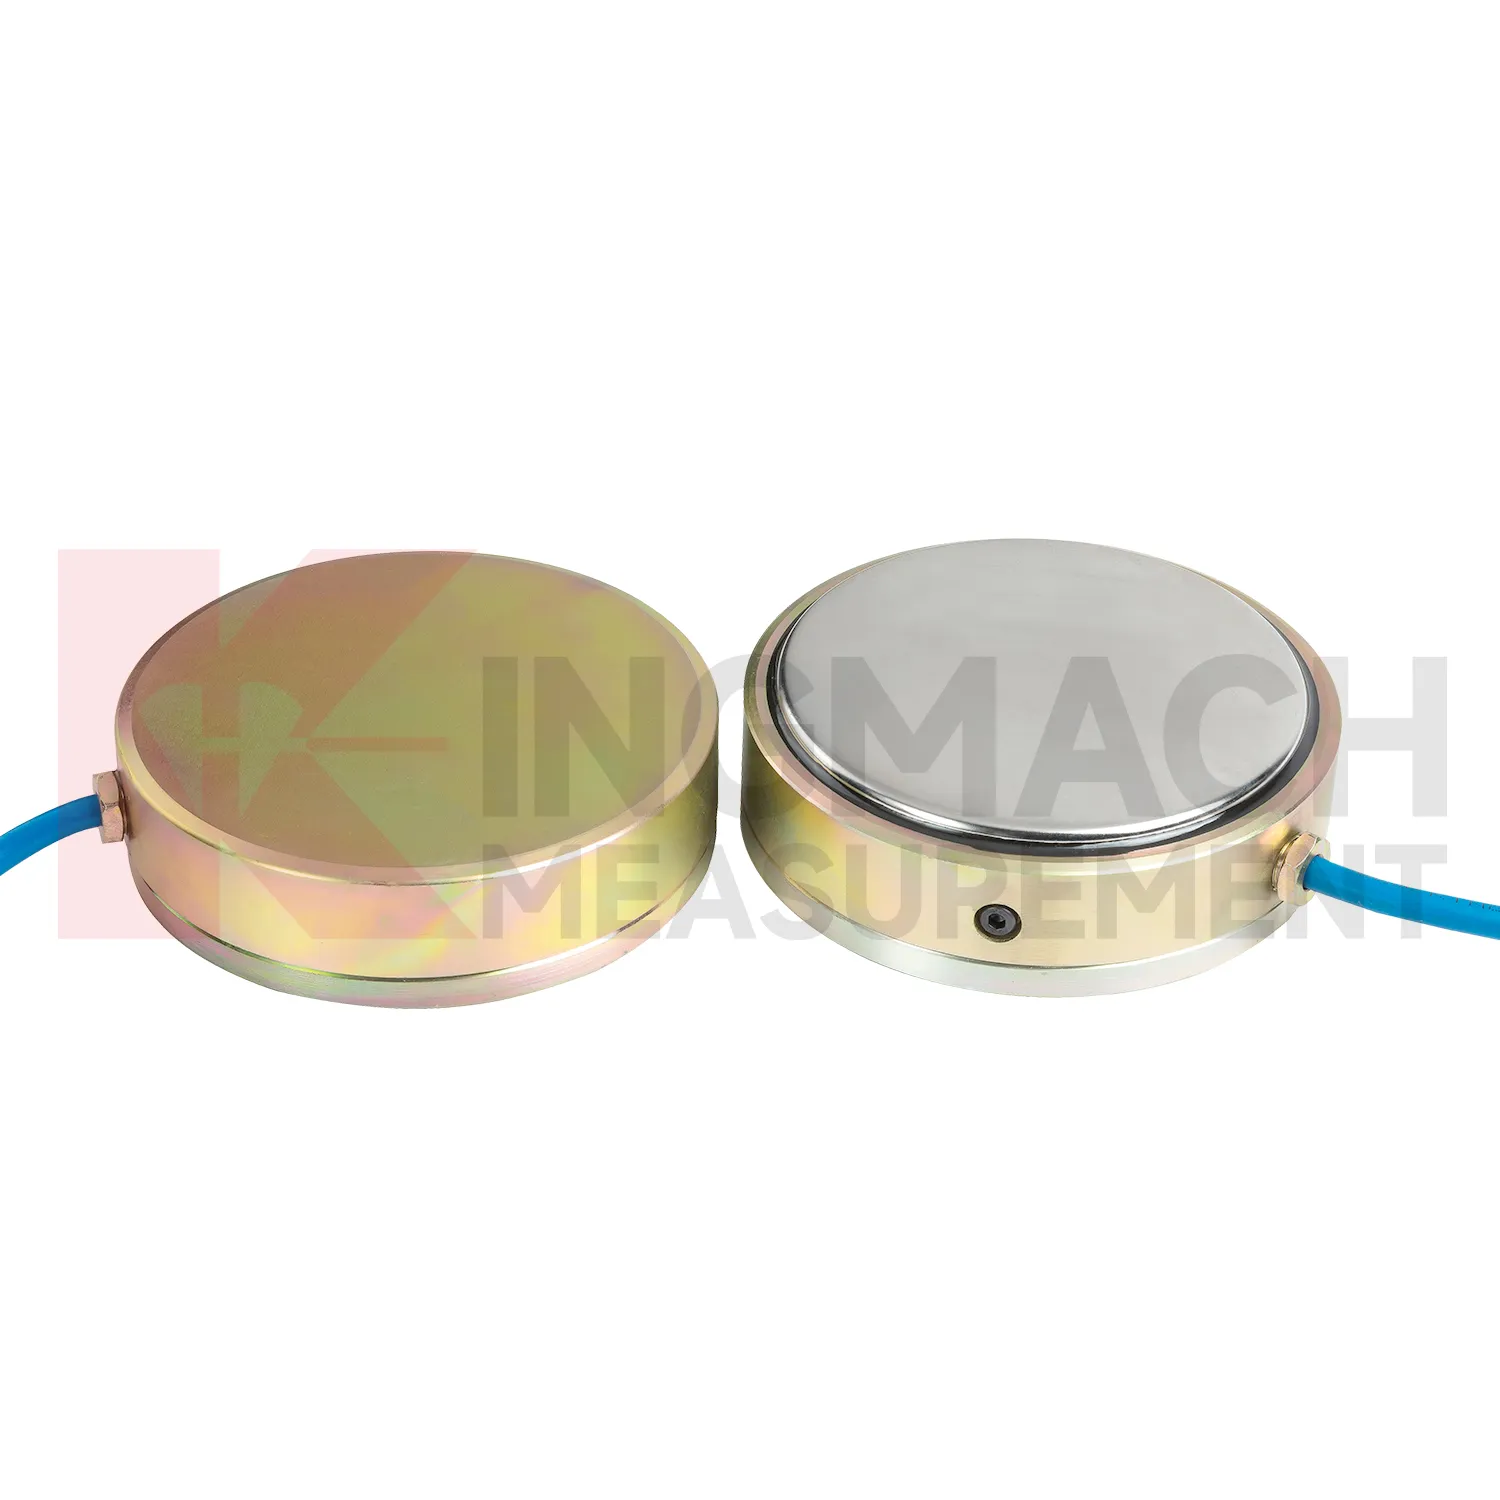
Kingmach load cell wiring diagram is developed for civil infrastructure where readings must remain usable after dust, vibration, water, and long cable runs enter the job. Product files describe vibrating wire based designs, smart chips, digital detection, strong anti-interference transmission, waterproof insulation, and automatic temperature correction. On the solid load cell JMZX-35XXHAT, the listed range runs from 1000 kN to 10000 kN with 0.1 kN resolution and 0.5%FS precision. On the hollow JMZX-3XXXHAT series, the listed range covers 500 kN to 8000 kN and the record memory can store 800 measurement entries. On the JMZX-38XXHAT axial force meter, the instrument can display axial force directly in kN. These details suit projects where force monitoring is part of acceptance, construction control, or long term service review. Kingmach's product grouping also supports mixed monitoring networks, where load readings sit beside water level, piezometer, displacement, settlement, and tilt data. For purchasing teams, this means the specification should include not only the sensor body, but also compatible readout equipment, cable length, protection accessories, calibration needs, and the reporting method expected by the owner. That reduces changes after the site work has already started. In practice, this means the specification should name the monitored member, expected reading frequency, installation exposure, and the person responsible for accepting the first stable value.
Application of load cell wiring diagram
In tunnel engineering and underground works, load cell wiring diagram is often placed on steel supports, temporary struts, surrounding rock pressure points, or contact zones near retaining elements. The main monitoring need is early detection of force change during excavation, lining work, grouting, groundwater fluctuation, or nearby construction. The JMZX-38XXHAT axial force load meter lists 200 kN to 3000 kN ranges, 0.1 kN or 1 kN sensitivity, 0.5%FS accuracy, direct kN display, and a 1 MPa waterproof rating. These parameters suit wet, crowded, and time sensitive underground sites. Where soil or contact pressure is the issue, earth pressure cells with 0.3 MPa to 8 MPa ranges and 0.001 MPa resolution can be added. The field problem is usually not a lack of readings, but knowing which reading belongs to which stage. Clear channel names, protected cables, and first stable readings after each excavation step help teams see whether the support system is loading normally or moving toward a risky pattern. For underground work, the first stable reading after each support stage should be kept with excavation depth, support time, and groundwater condition. That extra context helps explain whether a force change belongs to the structure, the soil, or the construction sequence.
The future of load cell wiring diagram
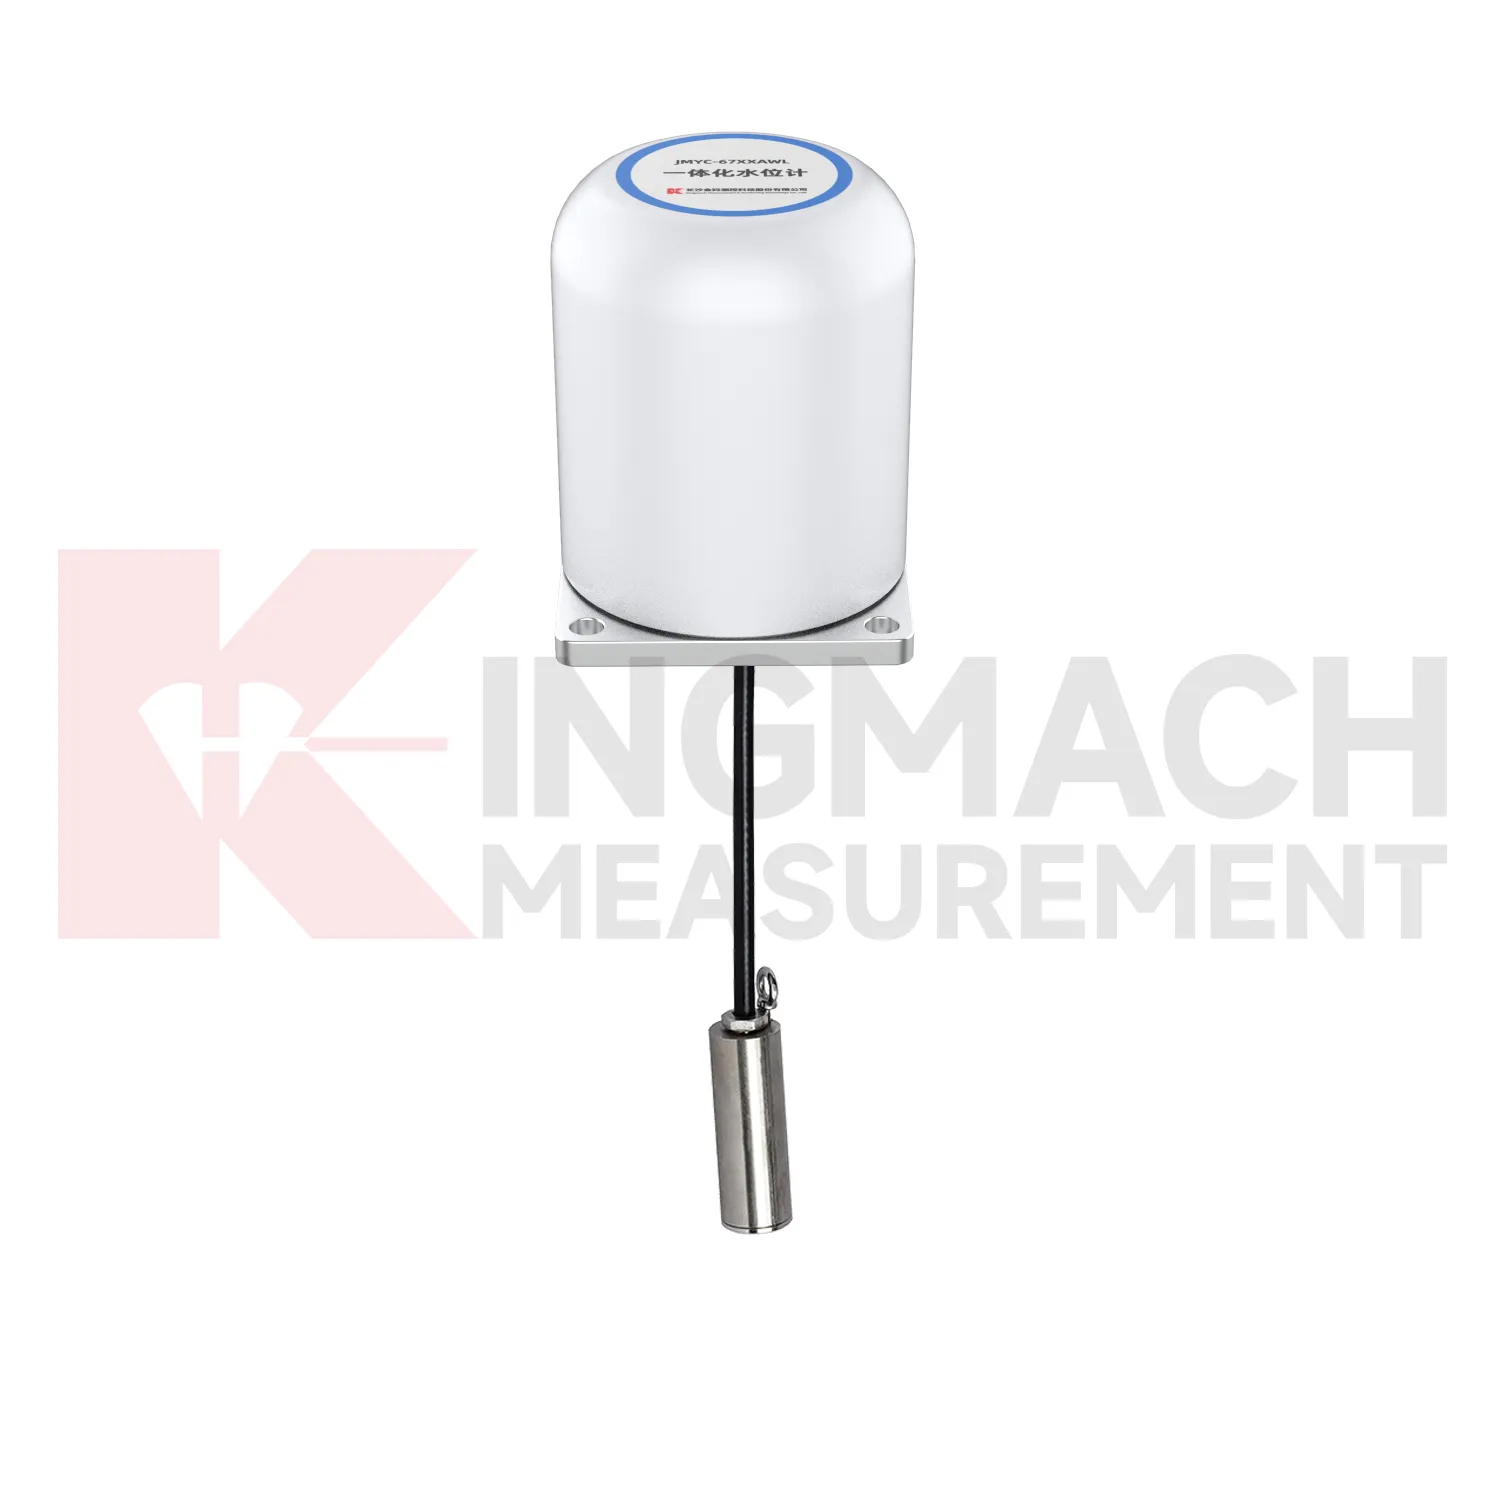
Geotechnical use of load cell wiring diagram will become more connected to environmental monitoring. Earth pressure cells with 0.3 MPa to 8 MPa ranges and 0.001 MPa resolution can already record soil or contact pressure, but future value comes from reading pressure with rainfall, groundwater, seepage, settlement, and slope movement. A pressure increase after rain may be acceptable in one slope and worrying in another, depending on the ground model and drainage condition. Digital twins can handle that comparison if the data is clean enough. Kingmach's wider catalog, including piezometers, water level meters, settlement sensors, tiltmeters, data loggers, and visualization software, supports that direction. Wireless communication will help remote slopes and embankments, while wired systems may remain preferable for buried points with long service expectations. Future standards for monitoring reports will likely ask for more traceable context around each reading, including sensor range, accuracy, calibration date, and installation depth. That connection makes trend review more useful after storms.
Care & Maintenance of load cell wiring diagram
For load cell wiring diagram used in pile load testing, care begins before the first load step. Confirm that the selected solid load cell range, often between 1000 kN and 10000 kN on Kingmach listed models, exceeds the planned test load with proper margin. Check the 0.1 kN resolution, 0.5%FS precision, calibration certificate, bearing plate flatness, and centering arrangement. During the test, protect the cable from jack movement and keep the readout position safe from vibration and water. Record zero value, temperature, load stage, hold time, unloading stage, and any pause or adjustment. After the test, inspect the sensor for dents, side load marks, connector damage, and cable jacket cuts. Store the calibration coefficient with the test report, not only with the instrument box. If later readings appear inconsistent, compare them with jack pressure, settlement data, and loading procedure before blaming the sensor. Store the report with the test file.
Kingmachload cell wiring diagram
load cell wiring diagram supports decisions that are too important to leave to visual inspection alone. A bridge anchor plate may look unchanged while force redistributes between strands. A deep excavation support may still be straight while axial load rises. A pile test may appear steady while the loading system introduces eccentric force. Kingmach's load monitoring range gives engineers several instrument formats for these different questions, including hollow, solid, axial force, and pressure related products. The field value depends on repeatability. A reading taken today must be comparable with the first stable reading, the next load stage, and the record after temperature changes. That is why calibration coefficients, zero values, cable labels, installation photos, and compatible readouts matter. When all of those details are controlled, force monitoring becomes a practical inspection record rather than a one-time test result. That discipline turns a single load point into evidence that can be reviewed months later.
FAQ
Q: When is a solid load cell wiring diagram more suitable than a hollow type? A: Solid models are commonly used for compression load, pile load testing, bridge pier support checks, and heavy bearing capacity measurement. Q: What specifications does the Kingmach solid load cell list? A: The JMZX-35XXHAT line lists 1000 kN to 10000 kN ranges, 0.1 kN resolution, 0.5%FS precision, and -30°C to 80°C working temperature. Q: How much overload margin is listed? A: Product information lists 20 to 50%F.S. range overload and 300 to 400%F.S. failure overload. Q: What installation errors affect accuracy? A: Eccentric loading, uneven bearing plates, side load, cable pulling, and missing zero records can all distort results. Q: What records should be kept for acceptance? A: Keep calibration coefficient, model, serial identity, load stages, temperature, zero value, and readout setting.
Reviews
Joshua Clark
We ordered a full monitoring solution including sensors and data loggers. Everything works seamlessly together. Great supplier!
David Wilson
We purchased displacement transducers and settlement sensors, and the quality exceeded our expectations. Easy installation and reliable performance.
Latest Inquiries
To protect the privacy of our buyers, only public service email domains like Gmail, Yahoo, and MSN will be displayed. Additionally, only a limited portion of the inquiry content will be shown.
Amelia***@gmail.comSingapore
Hello, I am looking for visualization software for monitoring system data analysis. Please let me kn...
Charlotte***@gmail.comUnited Arab Emirates
Hi, we require instrumentation cables suitable for harsh environments. Could you advise on specifica...