 ar
ar bg
bg hr
hr cs
cs da
da nl
nl fi
fi fr
fr de
de el
el hi
hi it
it ko
ko no
no pl
pl pt
pt ro
ro ru
ru es
es sv
sv tl
tl iw
iw id
id lv
lv lt
lt sr
sr sk
sk sl
sl uk
uk vi
vi et
et hu
hu th
th tr
tr fa
fa ms
ms hy
hy ka
ka ur
ur bn
bn mn
mn ta
ta kk
kk uz
uz ku
ku
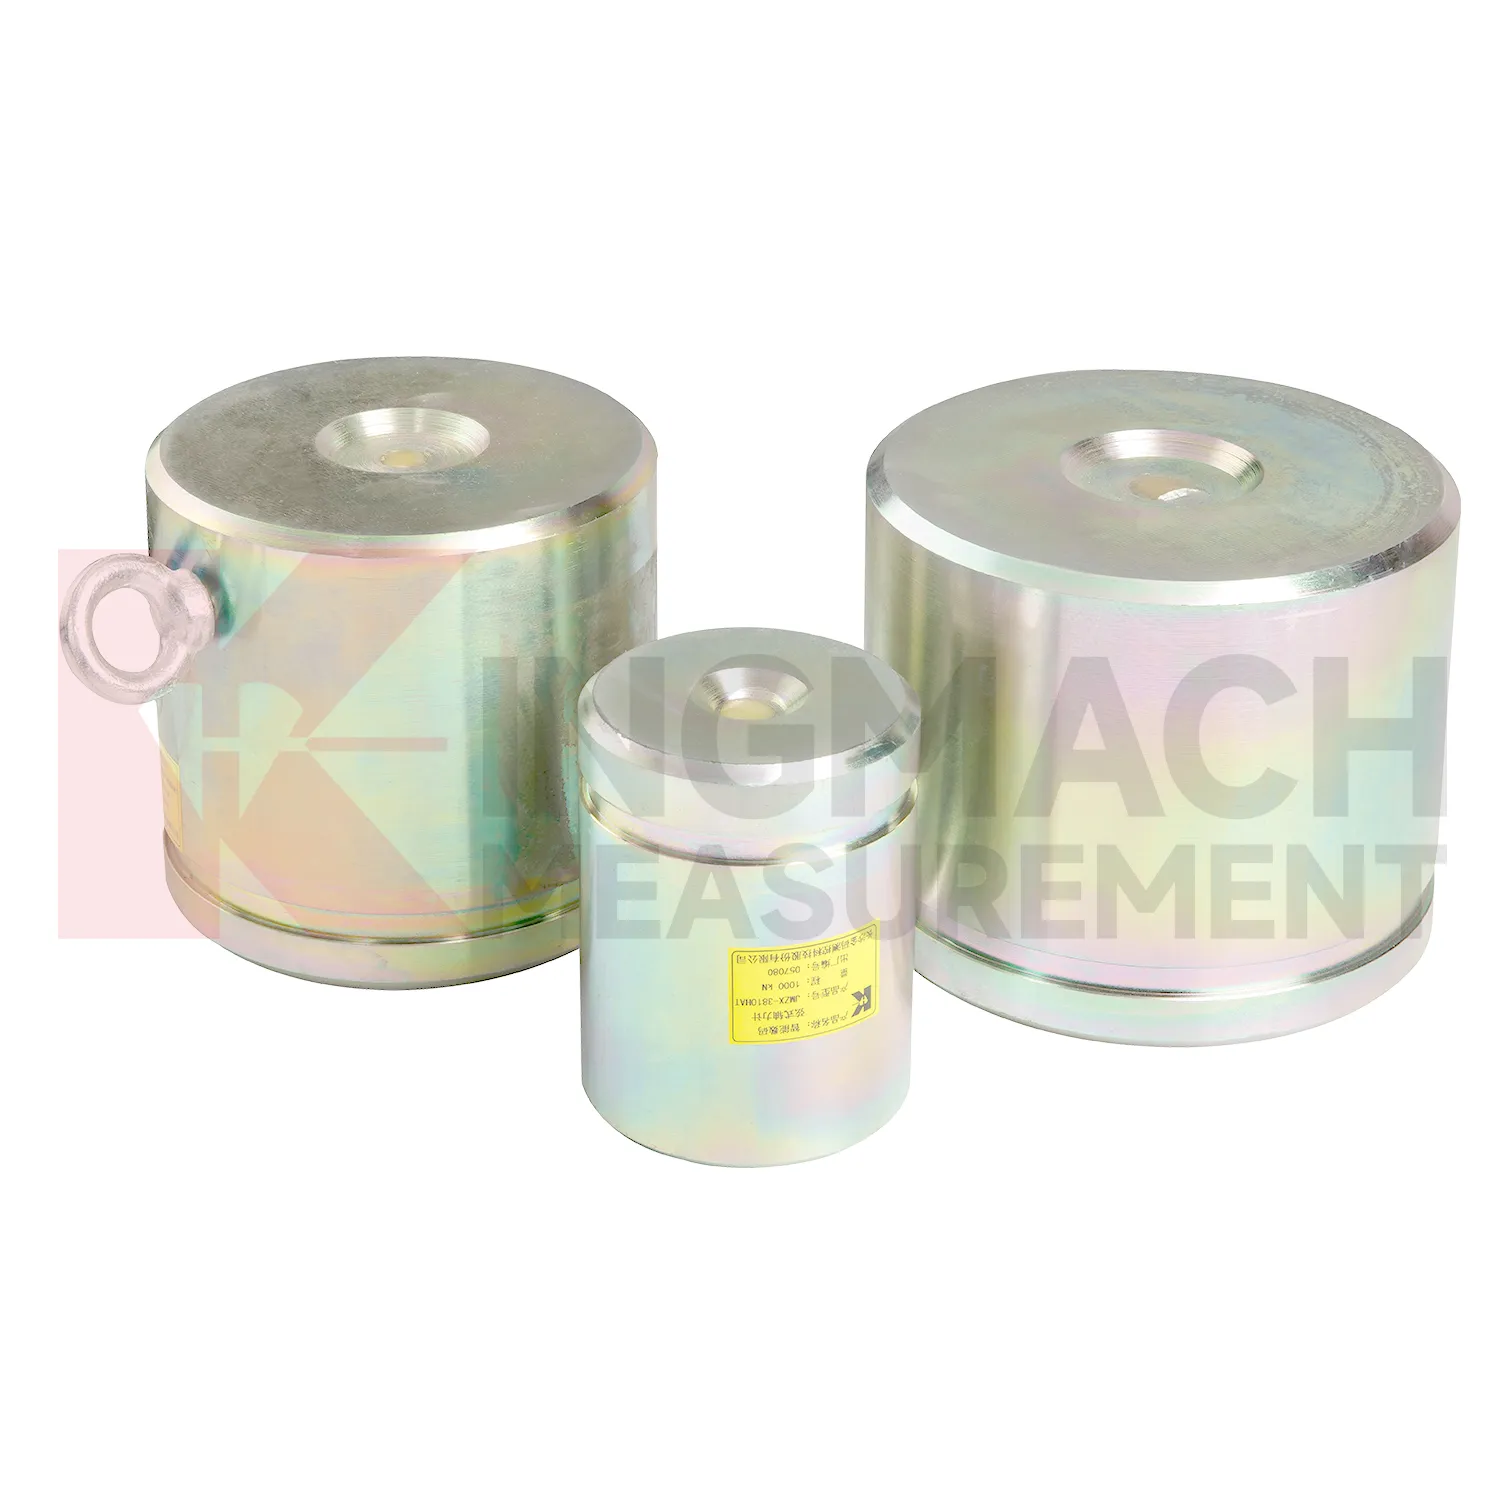
load cell connection diagram
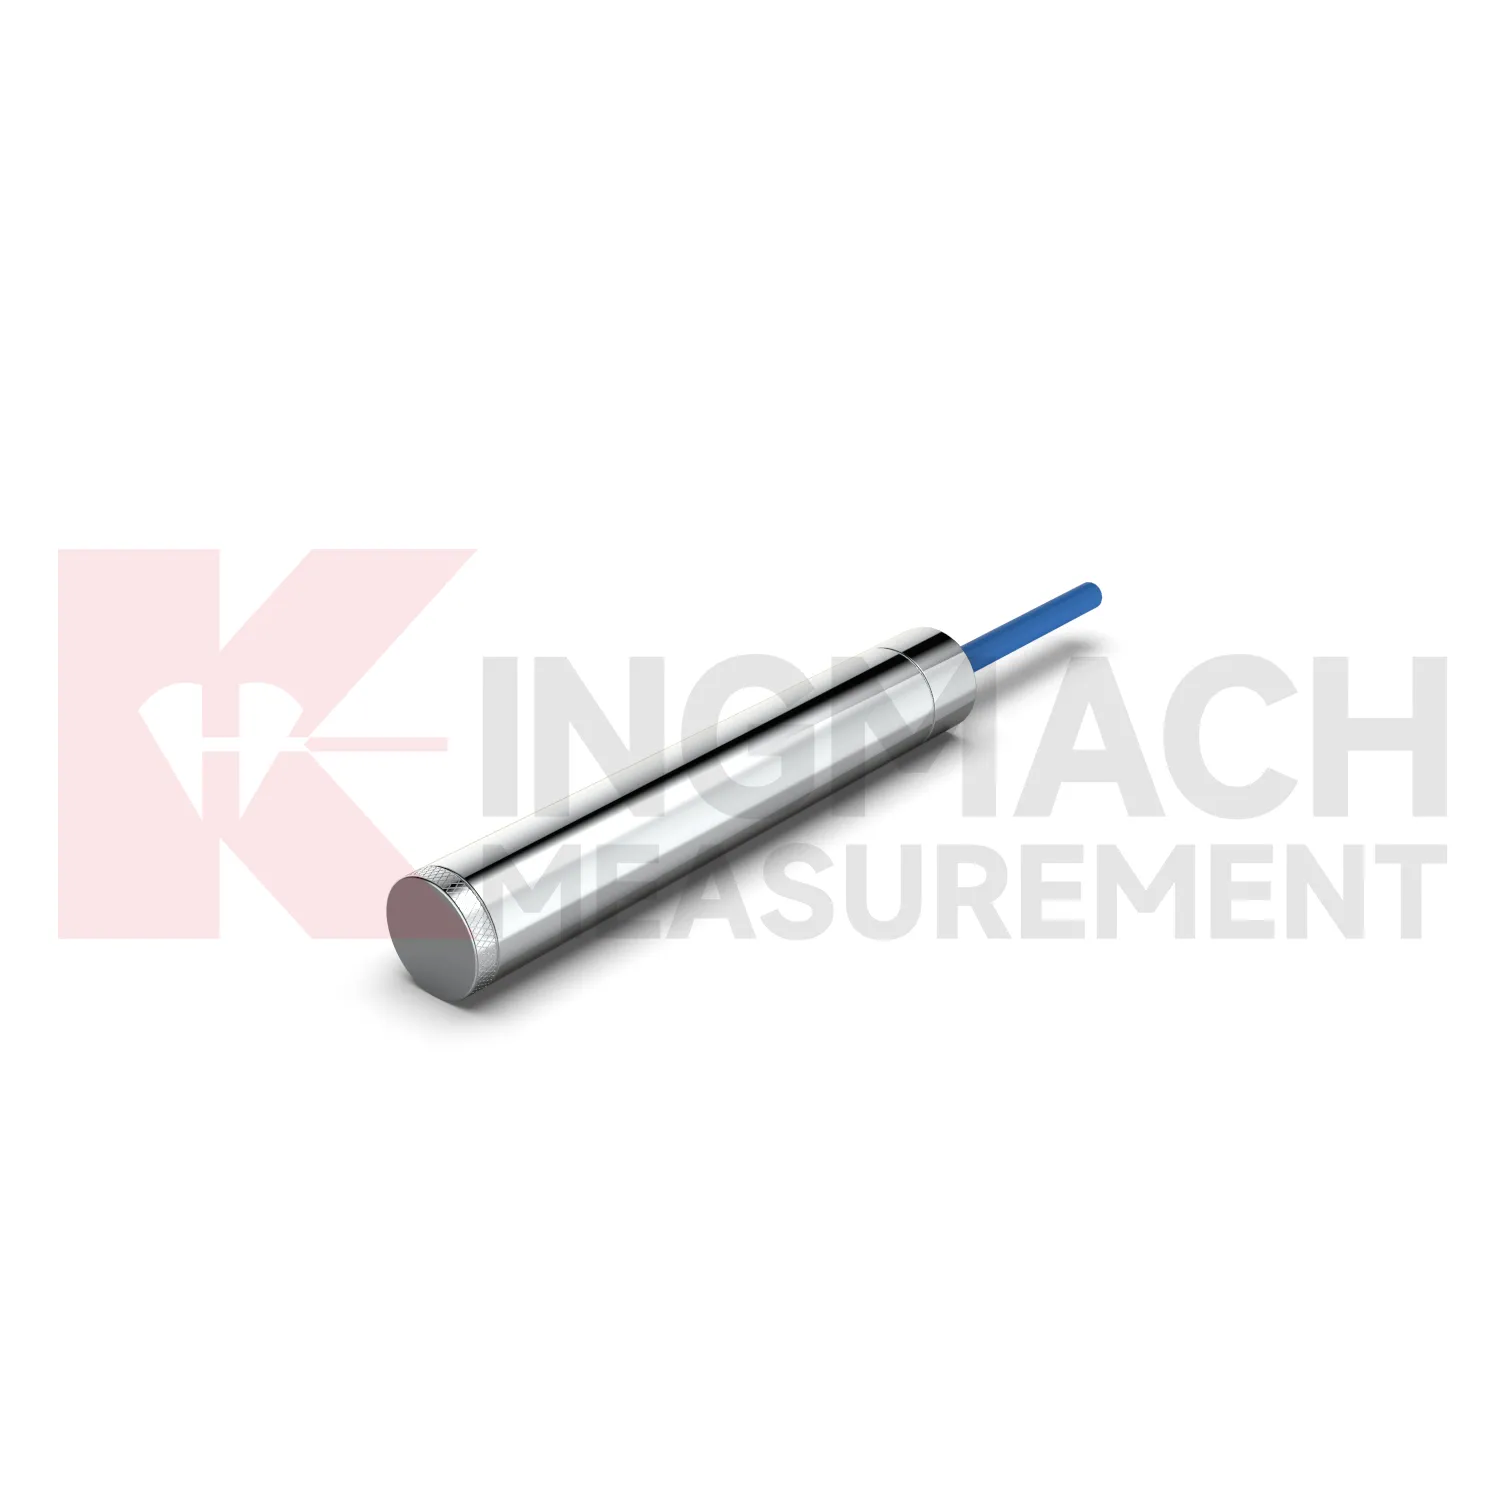
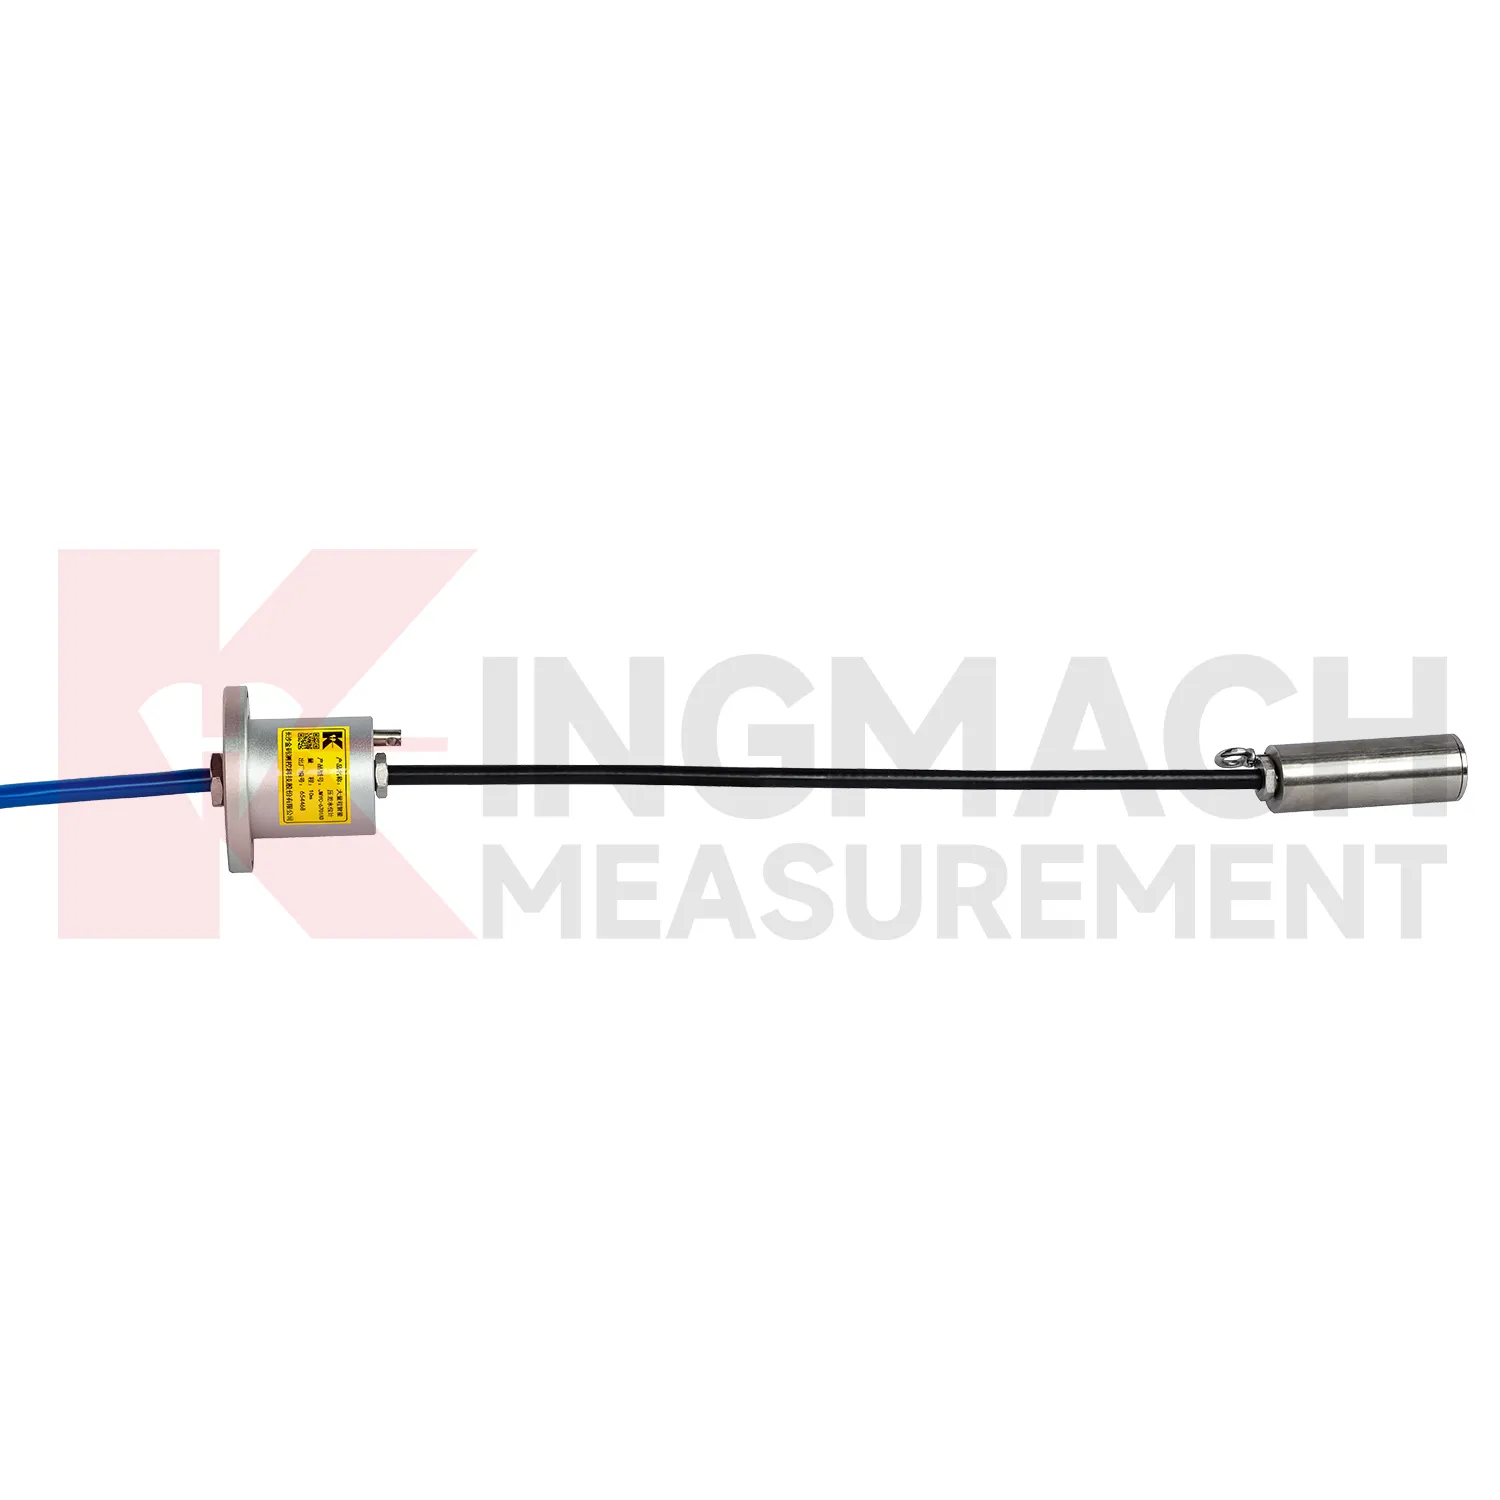
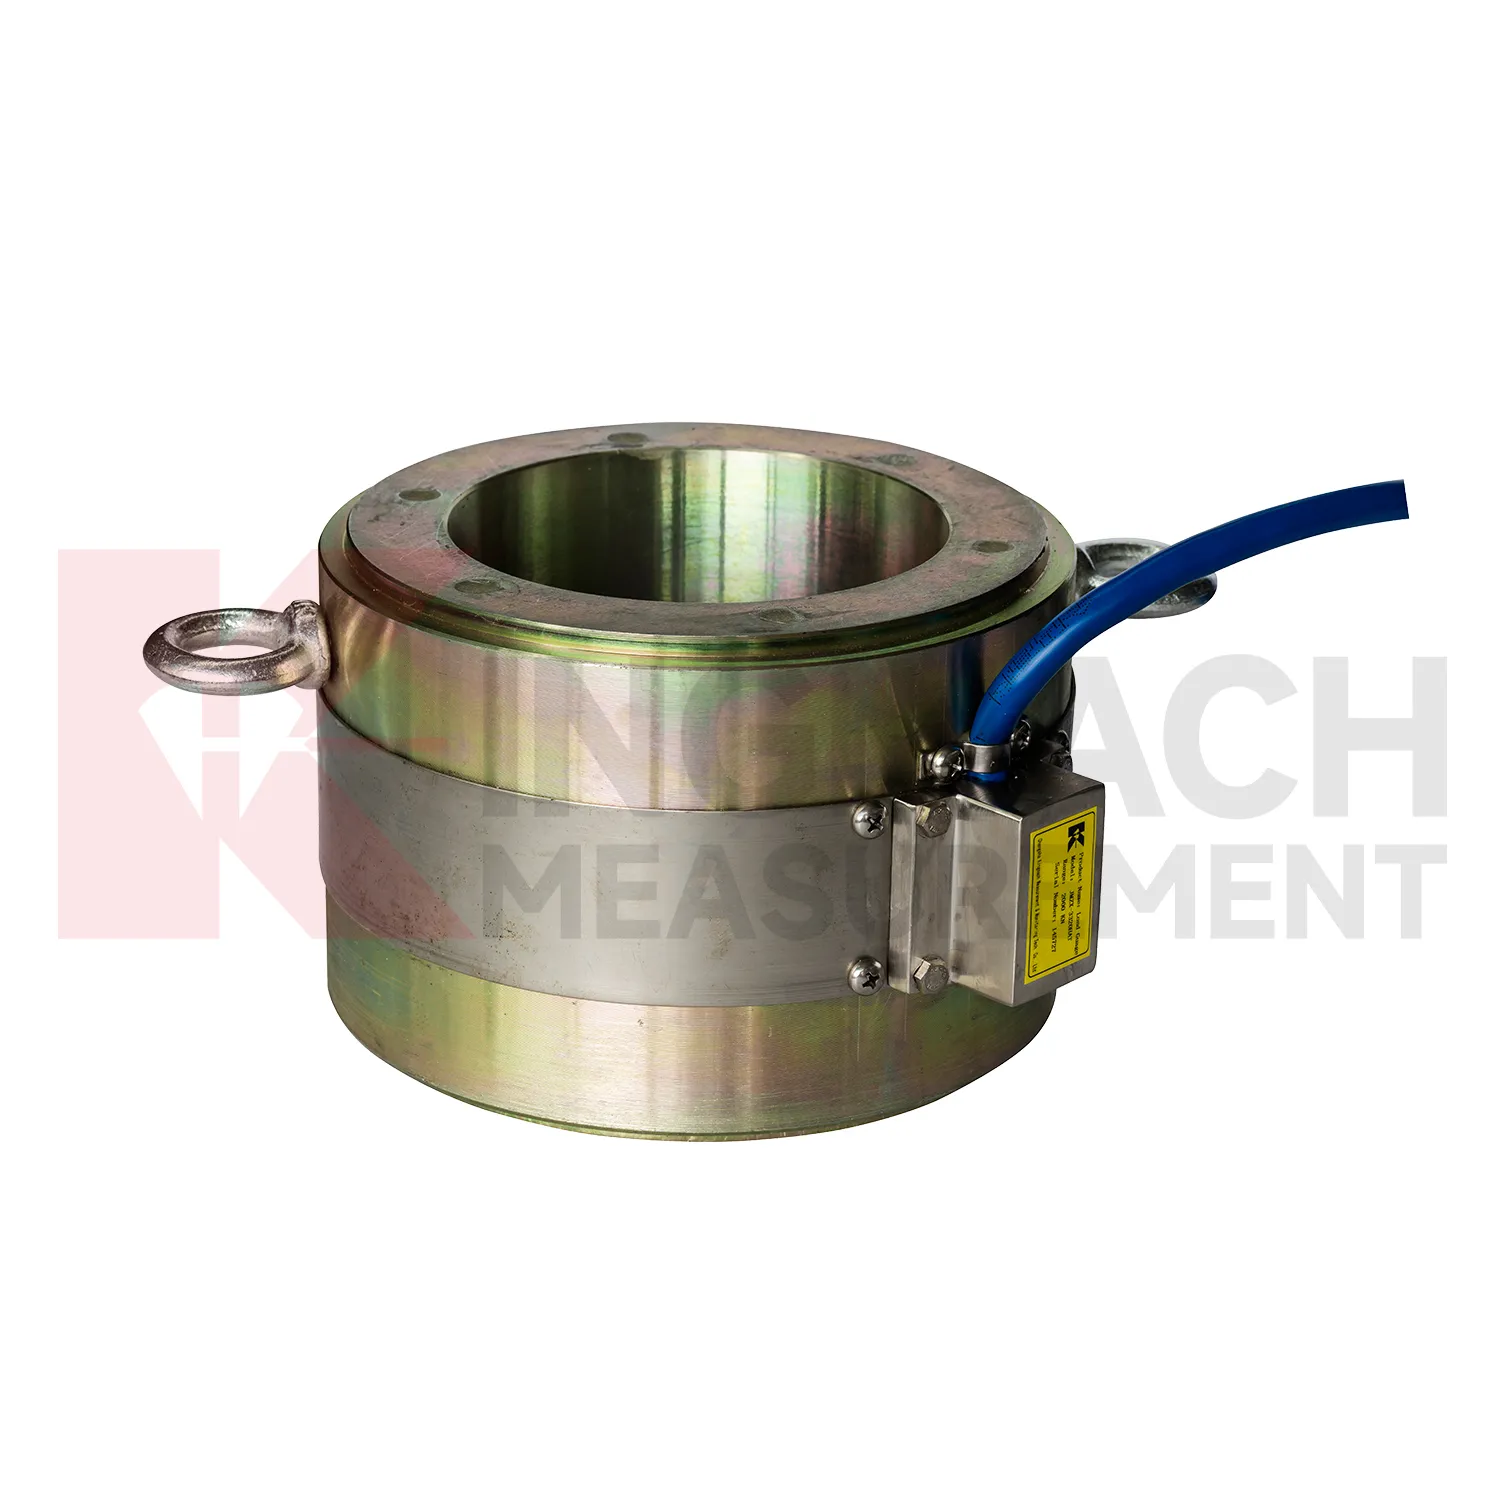
Kingmach load cell connection diagram products give engineers several ways to measure load depending on the contact condition. Hollow load cells fit cable and anchor force work, solid load cells fit compression and bearing capacity checks, axial force meters fit steel support monitoring, and earth pressure cells fit soil or contact pressure measurement. The listed technical span is broad: 500 kN to 8000 kN for hollow models, 1000 kN to 10000 kN for solid models, 200 kN to 3000 kN for axial force meters, and 0.3 MPa to 8 MPa for earth pressure cells. Accuracy and resolution are also stated in the product files, including 0.5%FS precision on main force models and 0.001 MPa resolution for pressure cells. Kingmach adds practical field features such as waterproofing, temperature correction, memory storage, digital output, and compatible readout instruments. A good specification compares these numbers with the design load, possible overload, installation surface, service environment, and planned inspection interval. This brand context fits projects that combine several monitoring categories rather than one isolated load point. A bridge or foundation pit may require force, settlement, displacement, water pressure, and software records in the same maintenance file, so compatibility should be reviewed early. The data record should also state whether the pressure or force point will be checked manually, automatically, or by both methods during handover.
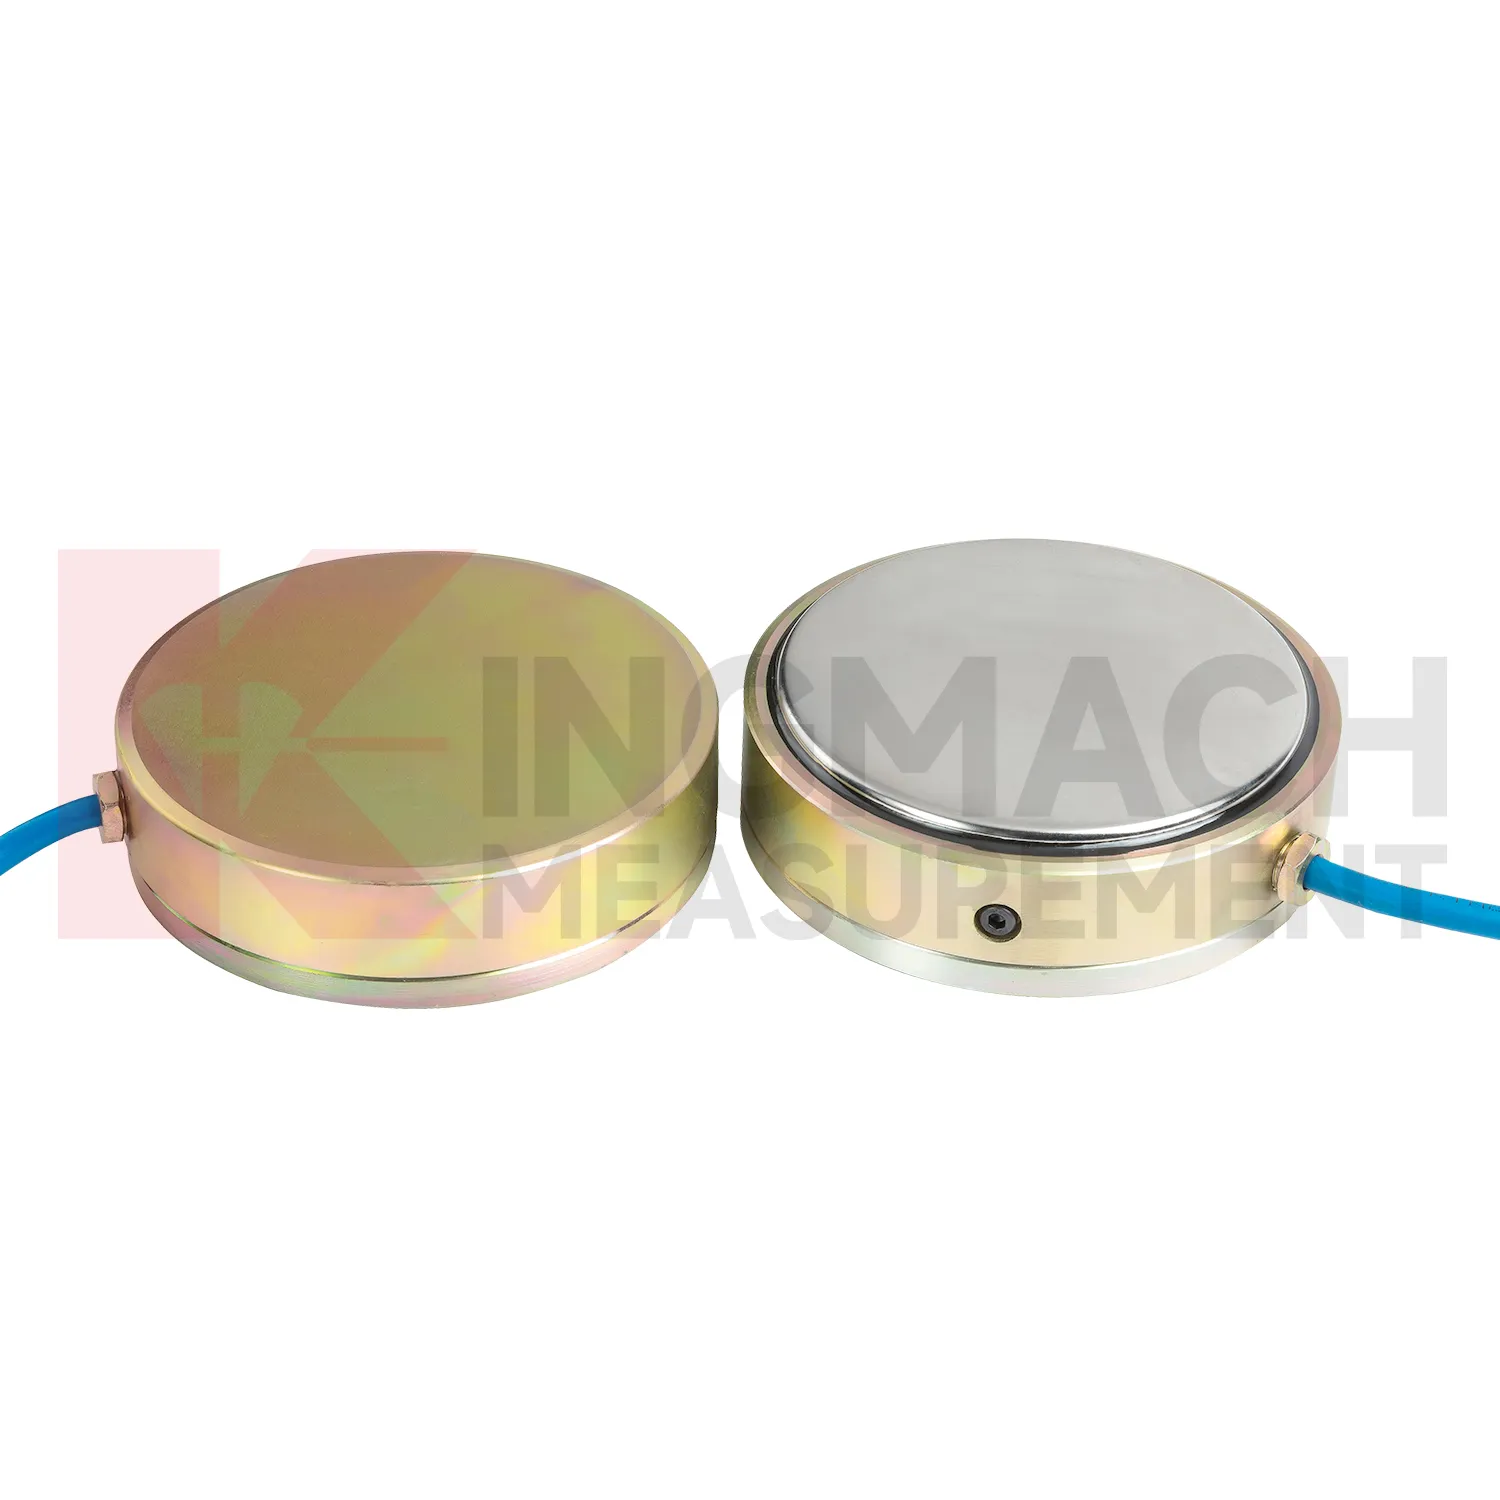
Application of load cell connection diagram
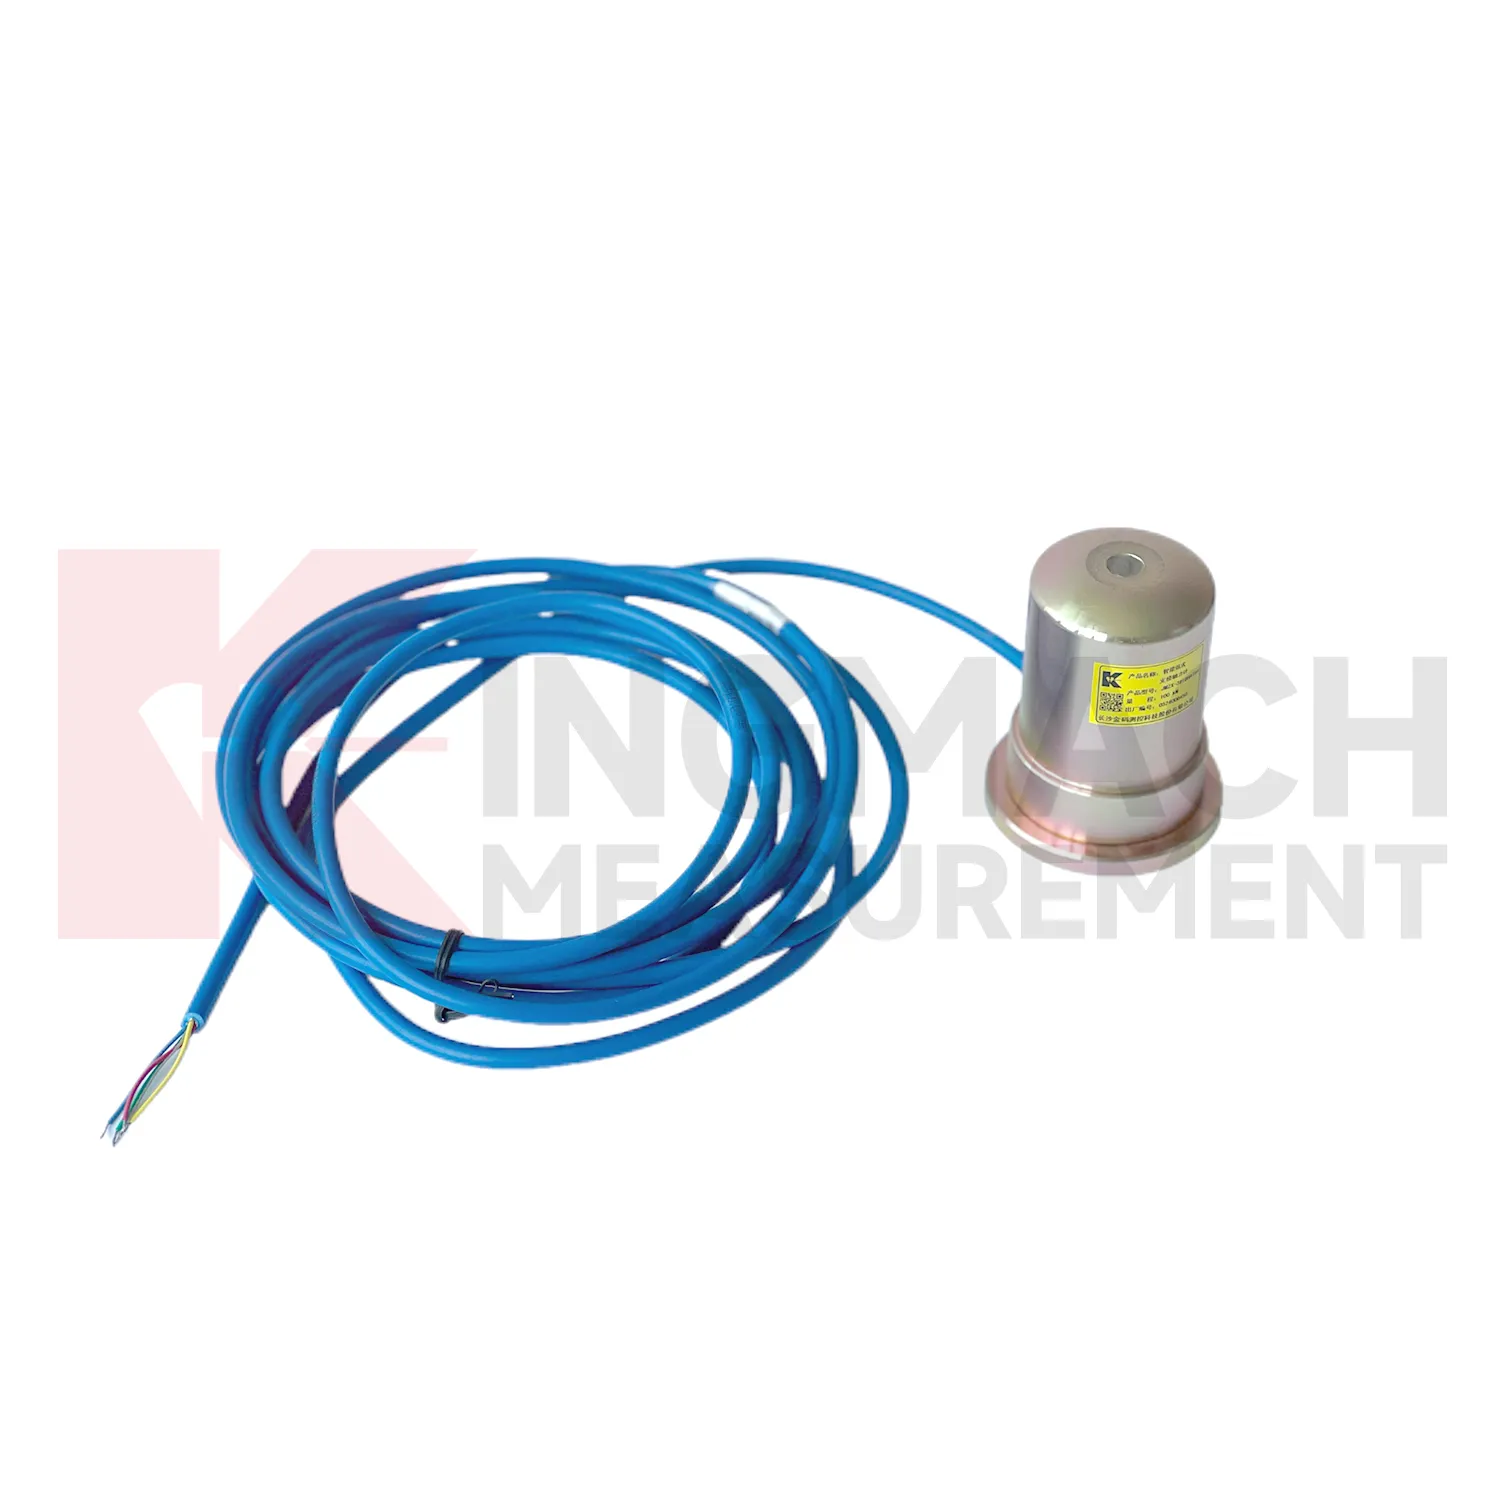
In monitoring networks that cover several structures, load cell connection diagram gives force and pressure points a place beside displacement, settlement, tilt, vibration, water level, and environmental data. The project pain point is interpretation across many channels. A force increase in a foundation pit may be normal after excavation, while a similar increase on a dam anchor after water level change may need closer review. Kingmach smart sensors can store model data, calibration coefficients, zero values, temperature data, and up to 800 records on relevant models. Load ranges across the family include 200 kN to 10000 kN for force products and 0.3 MPa to 8 MPa for earth pressure cells. When connected through readouts, data loggers, DTUs, or software platforms, these points can be reviewed by location and time. Good channel naming, consistent units, alarm thresholds based on design stages, and periodic field checks prevent the network from becoming a pile of disconnected numbers. Large networks also need a naming convention that crews can understand on site. A channel label that matches drawings, physical tags, and software screens prevents mistakes when alarms arrive during night work or bad weather. The platform should keep the raw reading history available, so later reviewers can see whether an alarm came from a real trend or a setup change.
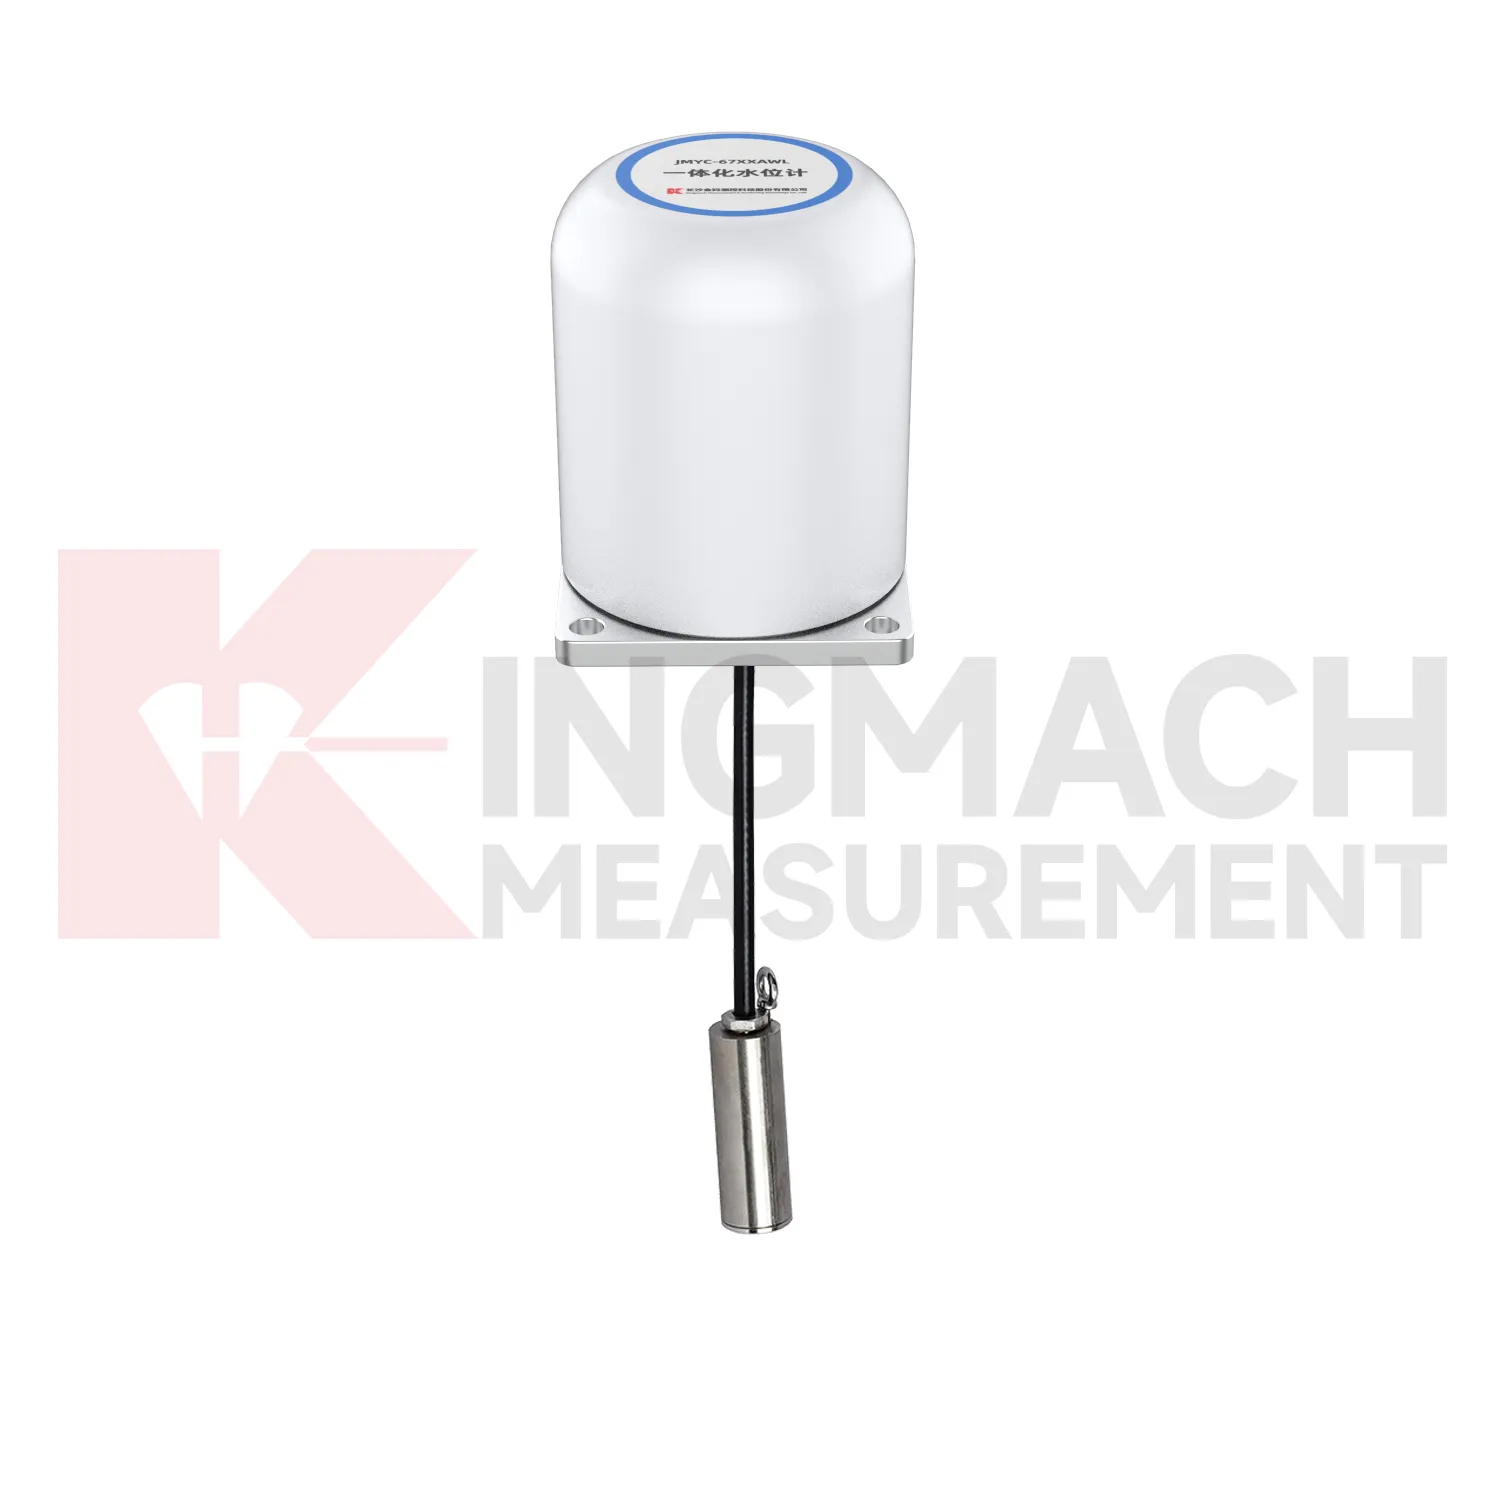
The future of load cell connection diagram
Geotechnical use of load cell connection diagram will become more connected to environmental monitoring. Earth pressure cells with 0.3 MPa to 8 MPa ranges and 0.001 MPa resolution can already record soil or contact pressure, but future value comes from reading pressure with rainfall, groundwater, seepage, settlement, and slope movement. A pressure increase after rain may be acceptable in one slope and worrying in another, depending on the ground model and drainage condition. Digital twins can handle that comparison if the data is clean enough. Kingmach's wider catalog, including piezometers, water level meters, settlement sensors, tiltmeters, data loggers, and visualization software, supports that direction. Wireless communication will help remote slopes and embankments, while wired systems may remain preferable for buried points with long service expectations. Future standards for monitoring reports will likely ask for more traceable context around each reading, including sensor range, accuracy, calibration date, and installation depth. That connection makes trend review more useful after storms.
Care & Maintenance of load cell connection diagram
For load cell connection diagram used in pile load testing, care begins before the first load step. Confirm that the selected solid load cell range, often between 1000 kN and 10000 kN on Kingmach listed models, exceeds the planned test load with proper margin. Check the 0.1 kN resolution, 0.5%FS precision, calibration certificate, bearing plate flatness, and centering arrangement. During the test, protect the cable from jack movement and keep the readout position safe from vibration and water. Record zero value, temperature, load stage, hold time, unloading stage, and any pause or adjustment. After the test, inspect the sensor for dents, side load marks, connector damage, and cable jacket cuts. Store the calibration coefficient with the test report, not only with the instrument box. If later readings appear inconsistent, compare them with jack pressure, settlement data, and loading procedure before blaming the sensor. Store the report with the test file.
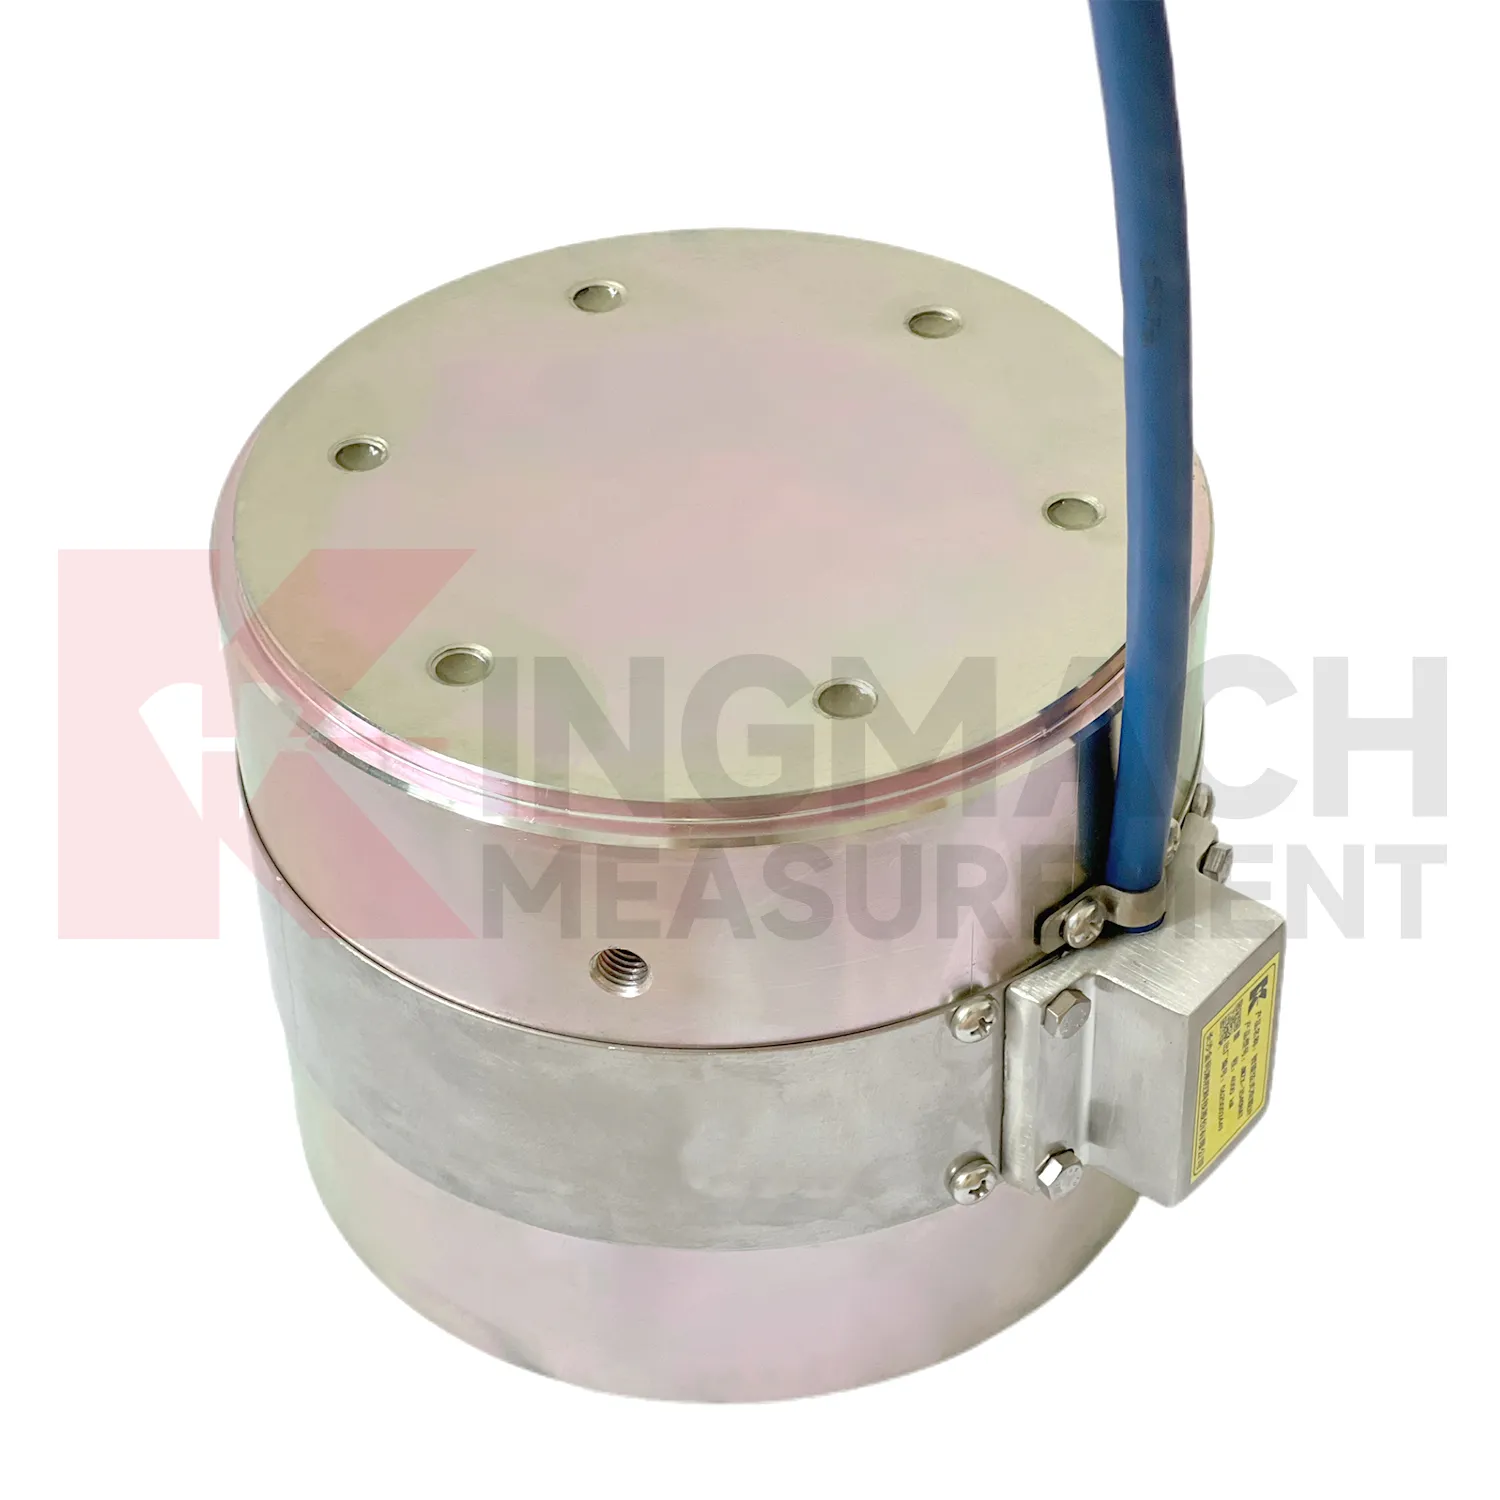
Kingmach load cell connection diagram
load cell connection diagram often sits between design intent and field behavior. Drawings may state the expected force, but site loading can change when excavation sequence, concrete curing, traffic, reservoir level, grouting, or prestressing work changes. Kingmach supplies sensors and acquisition equipment for bridges, tunnels, dams, subways, slopes, foundations, railways, buildings, and hydropower projects. In these settings, the sensor helps reveal whether a member is carrying its share of the load or taking more than expected. The instrument must fit the force range, the bearing surface, the environmental exposure, and the data workflow. A high capacity sensor with poor installation records is still hard to trust. A moderate range sensor with clear calibration, stable zero, protected cable, and a clean reading plan can produce stronger evidence. For that reason, force monitoring should be planned alongside installation details, not added after the site has already become crowded. This is especially useful when the monitored point becomes hidden after the next work stage.
FAQ
Q: How can load cell connection diagram be connected to a monitoring platform? A: Use compatible readouts, acquisition modules, data loggers, DTUs, and software platforms according to site access, cable distance, power, and reporting requirements. Q: What makes smart models useful in large networks? A: Stored model data, calibration coefficients, zero values, temperature data, and measurement records reduce confusion across many channels. Q: Should manual readings still be kept? A: Yes, manual checks are useful after installation, maintenance, abnormal alarms, or logger changes. Q: How should alarm limits be set? A: Base them on design stage, sensor range, expected load change, temperature behavior, and nearby monitoring points. Q: What data should be reviewed together with force? A: Settlement, displacement, tilt, water level, pore pressure, rainfall, temperature, construction events, and inspection notes.
Reviews
James Thompson
The tiltmeters and accelerometers are very sensitive and provide precise data. Perfect for our structural health monitoring system.
Daniel Brown
Excellent environmental monitoring sensors. The data is consistent, and the system integrates smoothly with our existing setup.
Latest Inquiries
To protect the privacy of our buyers, only public service email domains like Gmail, Yahoo, and MSN will be displayed. Additionally, only a limited portion of the inquiry content will be shown.
Ava***@gmail.comAustralia
Hi, I am looking for reliable tiltmeters and accelerometers for structural health monitoring. Please...
Charlotte***@gmail.comUnited Arab Emirates
Hi, we require instrumentation cables suitable for harsh environments. Could you advise on specifica...